Stack: FastAPI · OpenTelemetry · OTel Collector · Prometheus · Sloth · Alertmanager · Grafana · k6. Fully live-verified as of 2026-08-19/20, including two real alert-fires-to-email deliveries.
Most people's first contact with SLIs and SLOs is inside a vendor dashboard — Dynatrace draws the burn-rate chart, Datadog computes the error budget, and you never actually see the math. That's fine for using the platform. It's not fine for understanding it. So before I let a vendor collapse six moving parts into one button, I built the six moving parts myself: instrument a real app, compute real percentiles, define a real SLO, wire a real burn-rate alert, and watch a real email land in my inbox when the budget burns too fast.
This post is the hands-on record of doing that — goal, architecture, setup, what actually happened when I ran it, the bugs I hit along the way, and what changes if I hand the same problem to Dynatrace or Datadog instead.
What are SLIs/SLOs, and why Dynatrace or Datadog usually own this conversation
Two definitions worth being precise about before anything else:
- SLI (Service Level Indicator) — the actual measured number. "% of
/api/ordersrequests under 500ms." Just a ratio. - SLO (Service Level Objective) — the target for that SLI. "99% over a rolling 28 days." A promise, not a measurement.
The gap between the two is the error budget (1 − SLO), and how fast you're consuming it is the burn rate. A burn rate of 1 means you're exhausting the budget exactly on schedule; a burn rate of 5 means you'd blow through a 28-day budget in about 5.6 days if it kept up.
In production, most teams meet these concepts for the first time through Dynatrace or Datadog — SaaS observability platforms where an agent auto-instruments your app, a managed backend stores the telemetry, and SLO burn-rate is a form you fill in. That's genuinely great UX. It's also a black box: the platform does the histogram bucketing, the percentile math, and the multi-window burn-rate logic for you, which means you can operate an SLO dashboard for years without ever needing to understand what's actually inside it.
That's the whole pipe, vendor-collapsed. My goal was to build every stage of that pipe by hand first — open source only — so the concepts are provably understood independent of any vendor, and only then look at what Dynatrace/Datadog would remove.
Goal
Take a backend app, instrument it, compute real p95/p99 latency and error-rate SLIs, define an actual SLO, visualize it on a dashboard, and fire a real alert when the error budget burns too fast — with open-source tools I configured myself, not a managed platform.
Architecture — the six pieces, wired by hand
Prometheus also feeds Alertmanager (for burn-rate alerts) on a separate branch, and Sloth sits off to the side as a one-time code generator that produces the Prometheus rules Prometheus evaluates — it isn't a running service in the request path.
| Component | Role |
|---|---|
| OpenTelemetry (OTel) | Instrumentation layer. Vendor-neutral SDK that generates traces/metrics/logs from app code — auto-instruments HTTP, plus custom spans/histograms for business logic. Produces the raw data, ships it over OTLP. |
| OTel Collector | Standalone process that receives OTLP from the app and routes it — here, re-exporting metrics in Prometheus's scrape format. |
| Prometheus | Time-series DB + scraper. Polls the Collector's /metrics, stores histogram buckets, answers PromQL (histogram_quantile(0.95, ...)), evaluates alert rules. |
| Sloth | A code generator, not a service. Takes an SLO spec and generates the Prometheus recording + multi-window burn-rate alert rules — encodes the Google SRE-book pattern so I didn't have to hand-derive that math. |
| Alertmanager | Takes firing alerts from Prometheus and handles routing/dedup/grouping/silencing, then notifies (email, here). Prometheus decides when something's wrong; Alertmanager decides who hears about it and how. |
| Grafana | Dashboard layer. Queries Prometheus, renders panels: p50/p95/p99, error rate, error-budget burn-down. |
Chain, in one line: OTel instruments → Collector routes → Prometheus stores/computes → Sloth generates the SLO rules Prometheus evaluates → Alertmanager notifies → Grafana visualizes.
The demo app is a FastAPI service with two endpoints — POST /api/orders and GET /api/search — with deterministic fault injection: a 2% error rate on both, and a 5% chance /api/orders takes a slow path (adds 0.5–1.5s on top of its normal 50–200ms). That 5% slow-path rate is the whole story of this post — it's tuned to blow a 99% latency SLO on purpose.
Setting it up
Docker Compose brings up all five containers (app, OTel Collector, Prometheus, Grafana, Alertmanager) with one command, k6 drives the 5-minute load test, and Sloth generates the real multi-window burn-rate rules on top of the hand-written fallback. I'm not walking through the commands here — the full runnable setup, with the exact prerequisites, pre-flight checks, Gmail SMTP config, and the gotchas I hit at each step, is in the repo itself:
What happened when I ran it
The fault injection is probabilistic, so exact numbers vary run to run, but here's what a real 5-minute k6 run against this stack produces:
The interesting numbers are the last two: the SLO target is 99%, but the app is deliberately built to only hit ~95% (only the 5% slow-path requests cross 500ms, so success ≈ 1 − 0.05). That means burn rate should sit around (1 − 0.95) / (1 − 0.99) = 5x — a clearly failing SLO, not a near-1x hairline. If a run instead shows success near 99% or burn near 1, that's the signal something's wrong (short traffic window, bad query, a code regression) — not "everything's fine."
This is exactly what my own dashboard showed, live:
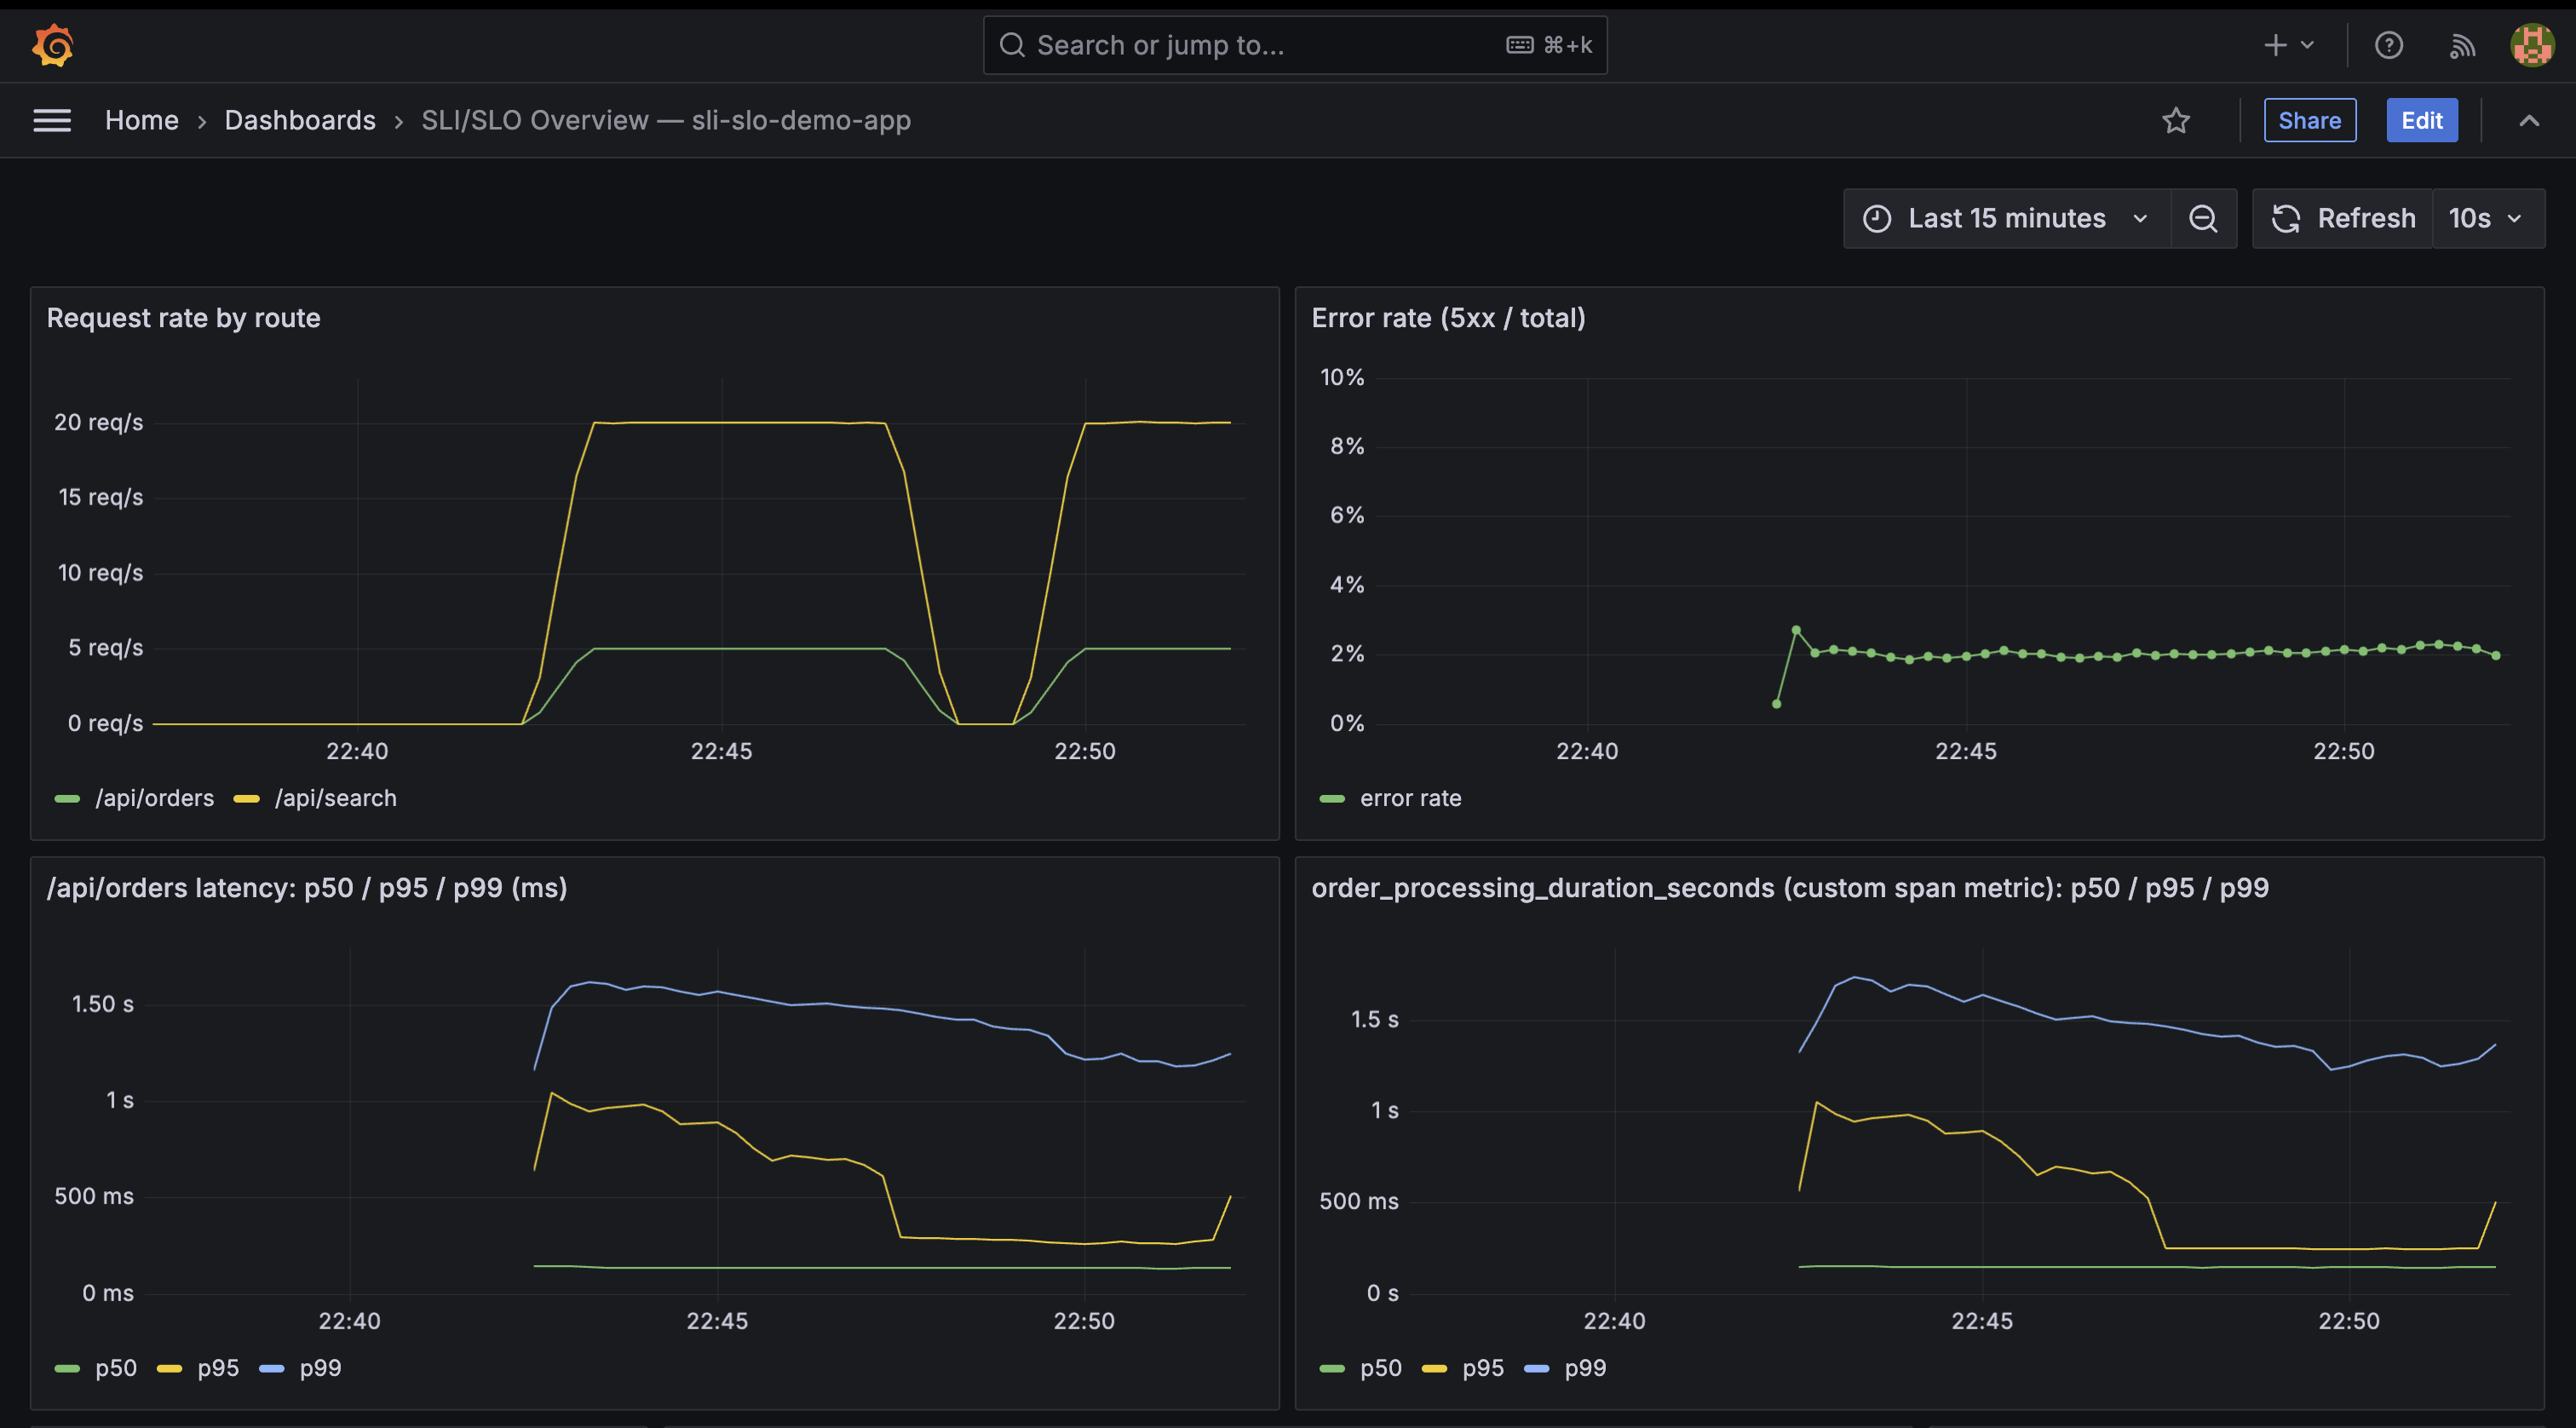
Request rate settles right at the 5 and 20 req/s lines k6 was configured for. Error rate sits at ~2%, on an axis capped at 10% specifically so a 2% line isn't an invisible hairline on a 0–100% scale. p99 latency on /api/orders (both the auto-instrumented HTTP metric and my own custom order_processing_duration_seconds span) tracks well above p50, pulled up by the slow-path tail — exactly the shape percentiles are supposed to reveal and averages hide.
And the SLO panel itself:
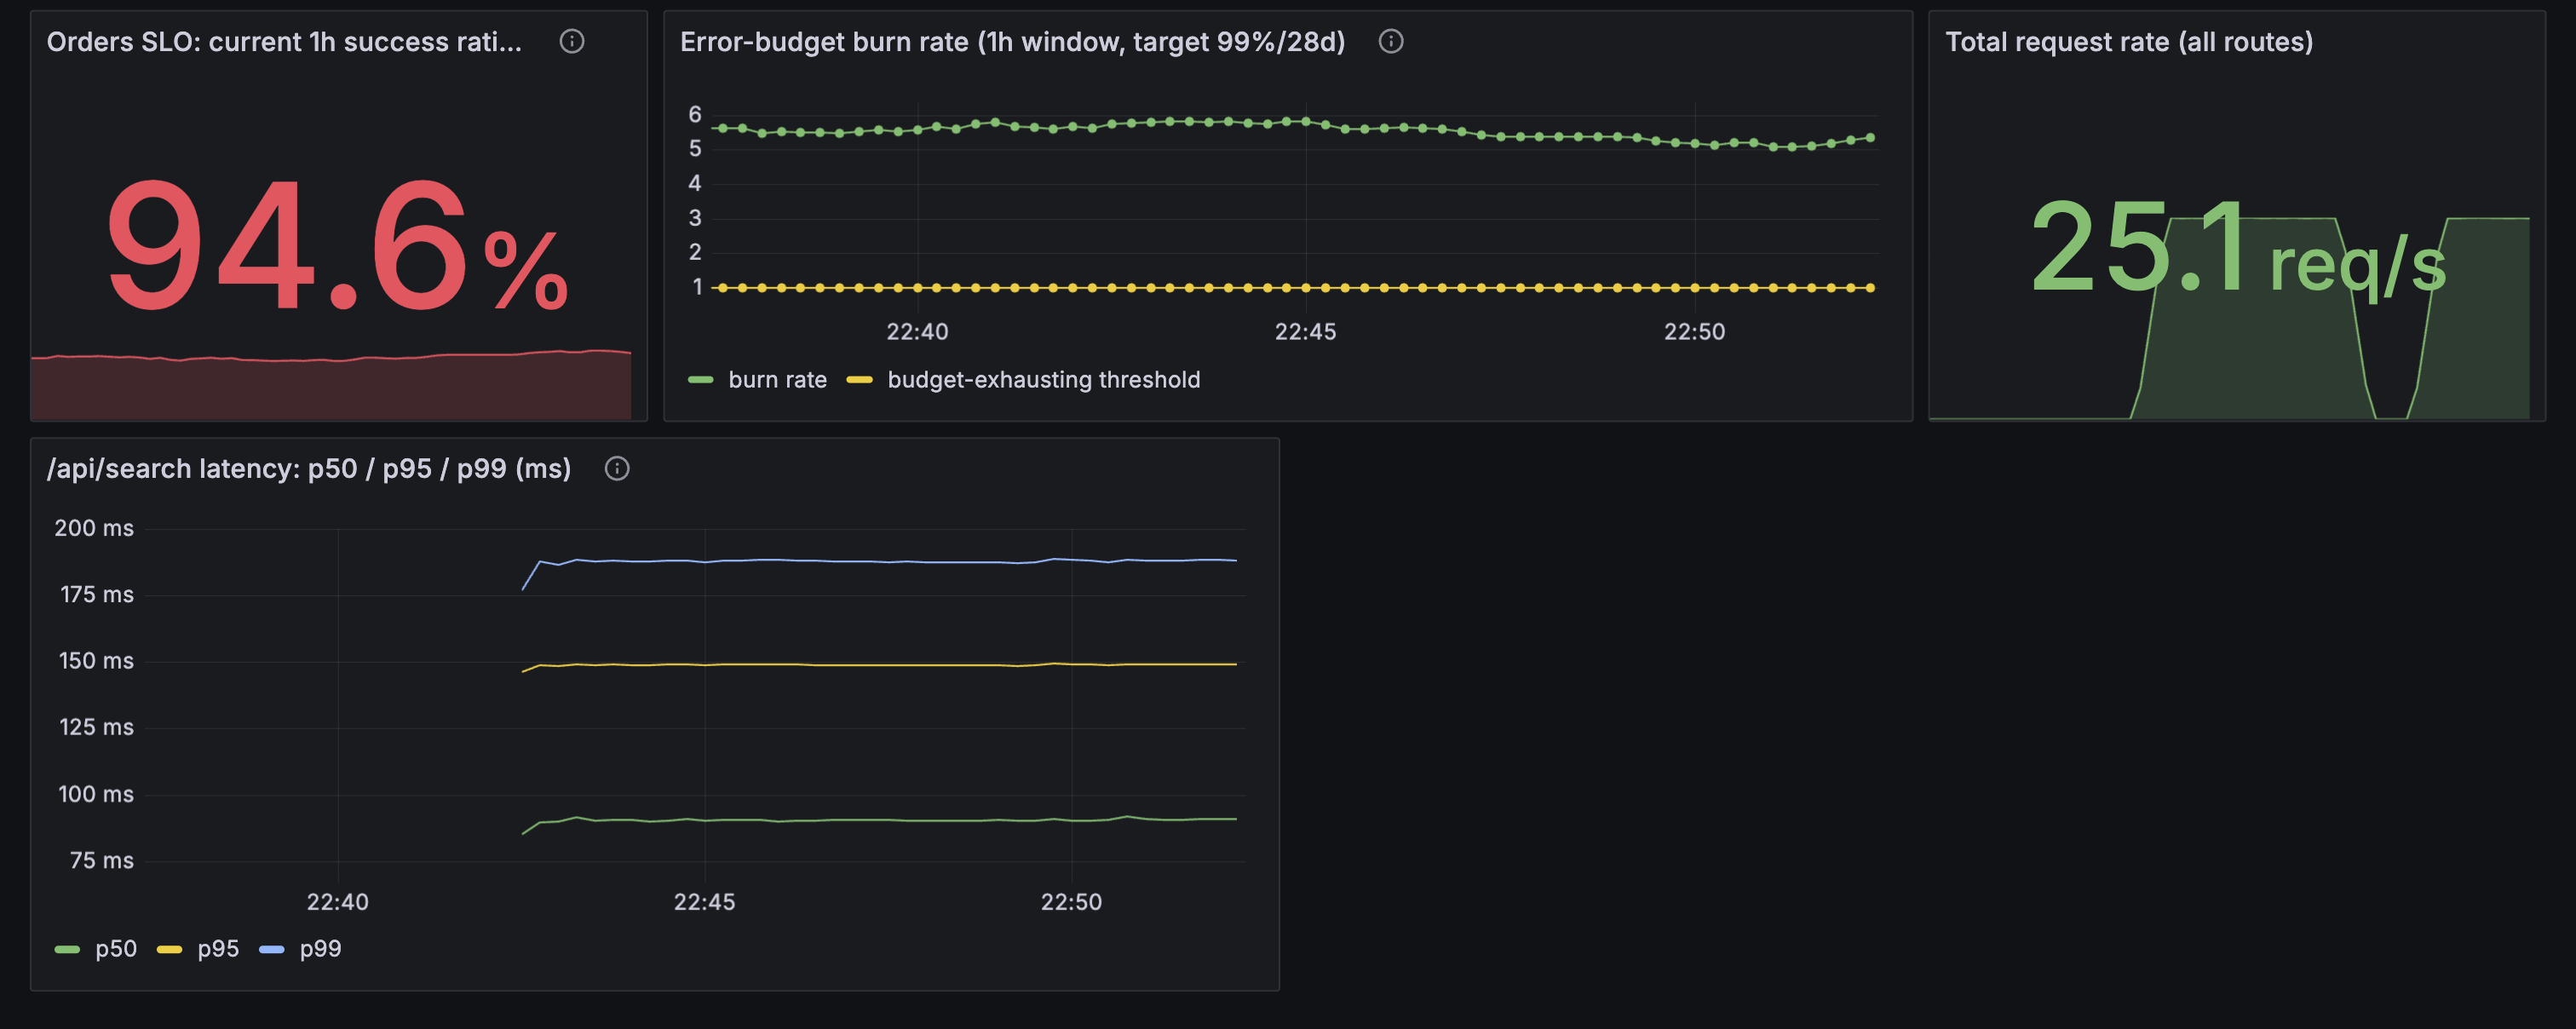
94.6% success ratio against a 99% target, colored red (green only kicks in above 99%). Burn rate sitting around 5-6x — well above the "1" reference line, confirming the theoretical 5x from the fault-injection math. This is the moment the abstract "error budget" concept stops being a slide and becomes a number I watched move in real time because I was burning it on purpose.
The alert fired for real
The manual burn-rate rule requires burn rate to stay above 1x for a full 5 minutes (for: 5m) before moving from pending to firing. I watched it happen through curl http://localhost:9090/api/v1/rules, then confirmed it visually:
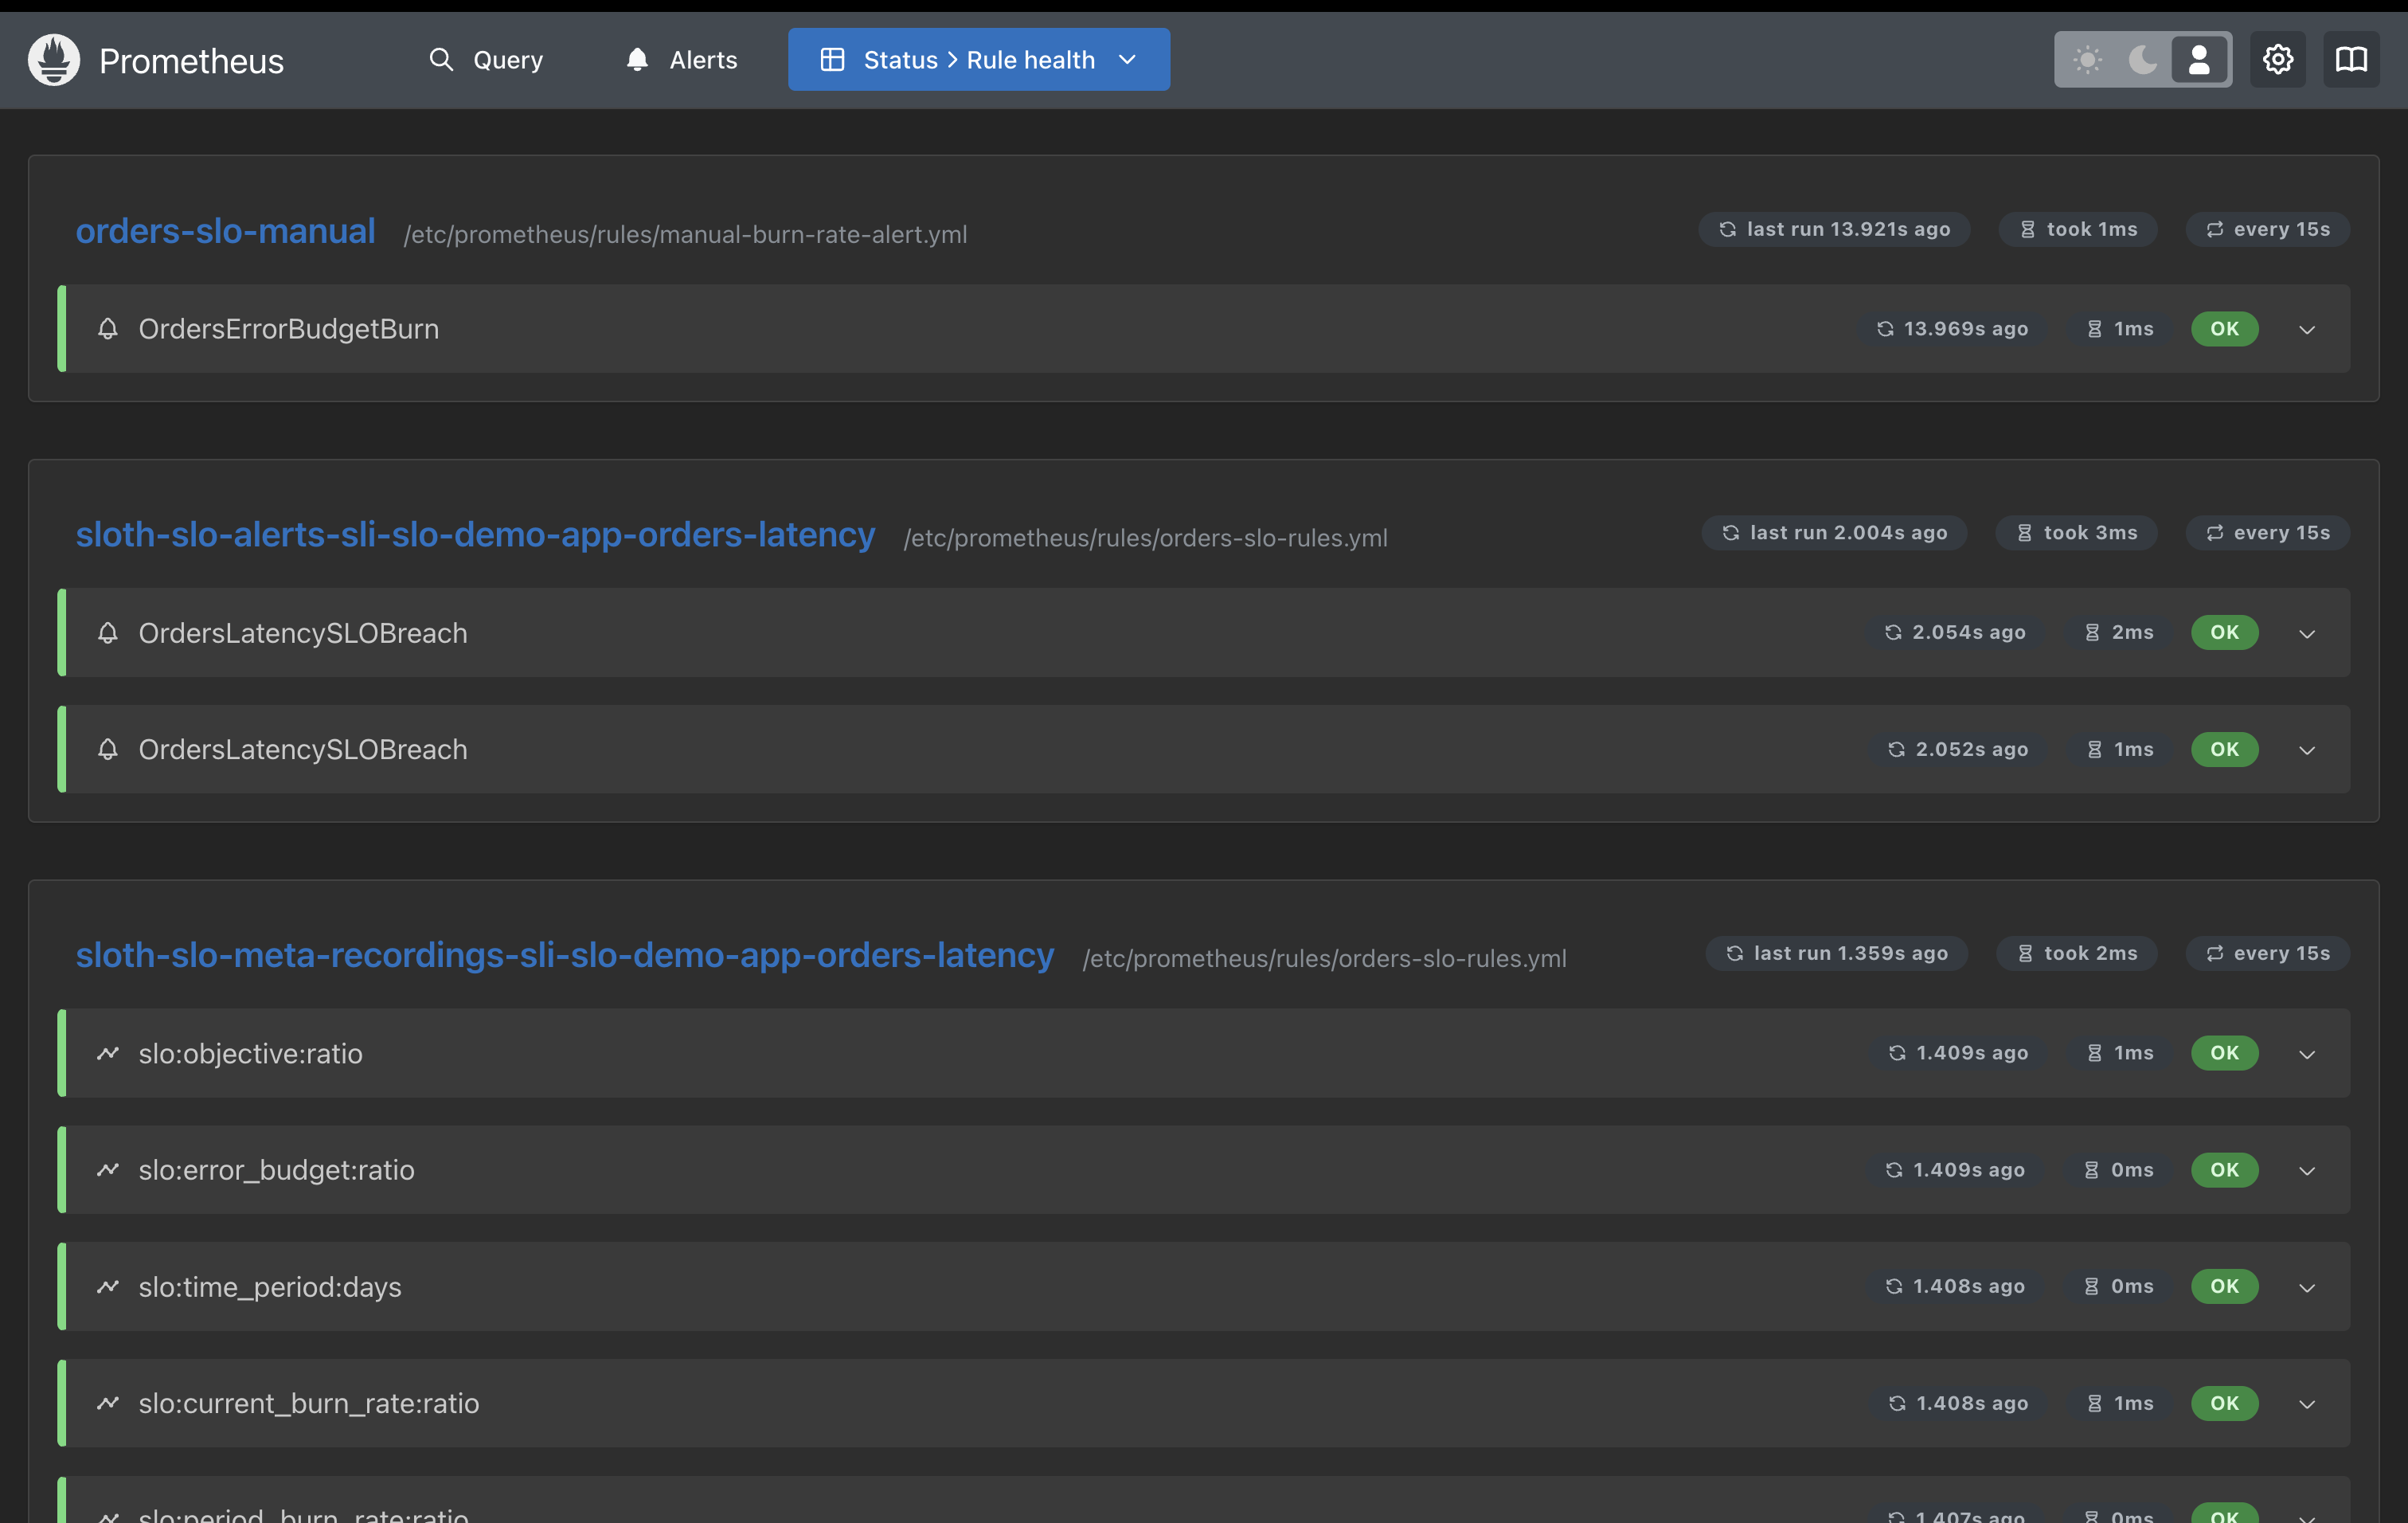
Both rule groups loaded side by side — the hand-written orders-slo-manual group and the Sloth-generated multi-window group (sloth-slo-alerts-... and its companion sloth-slo-meta-recordings-... group producing the slo:objective:ratio, slo:error_budget:ratio, and slo:current_burn_rate:ratio recording rules underneath).
Then, once the burn stayed high long enough:
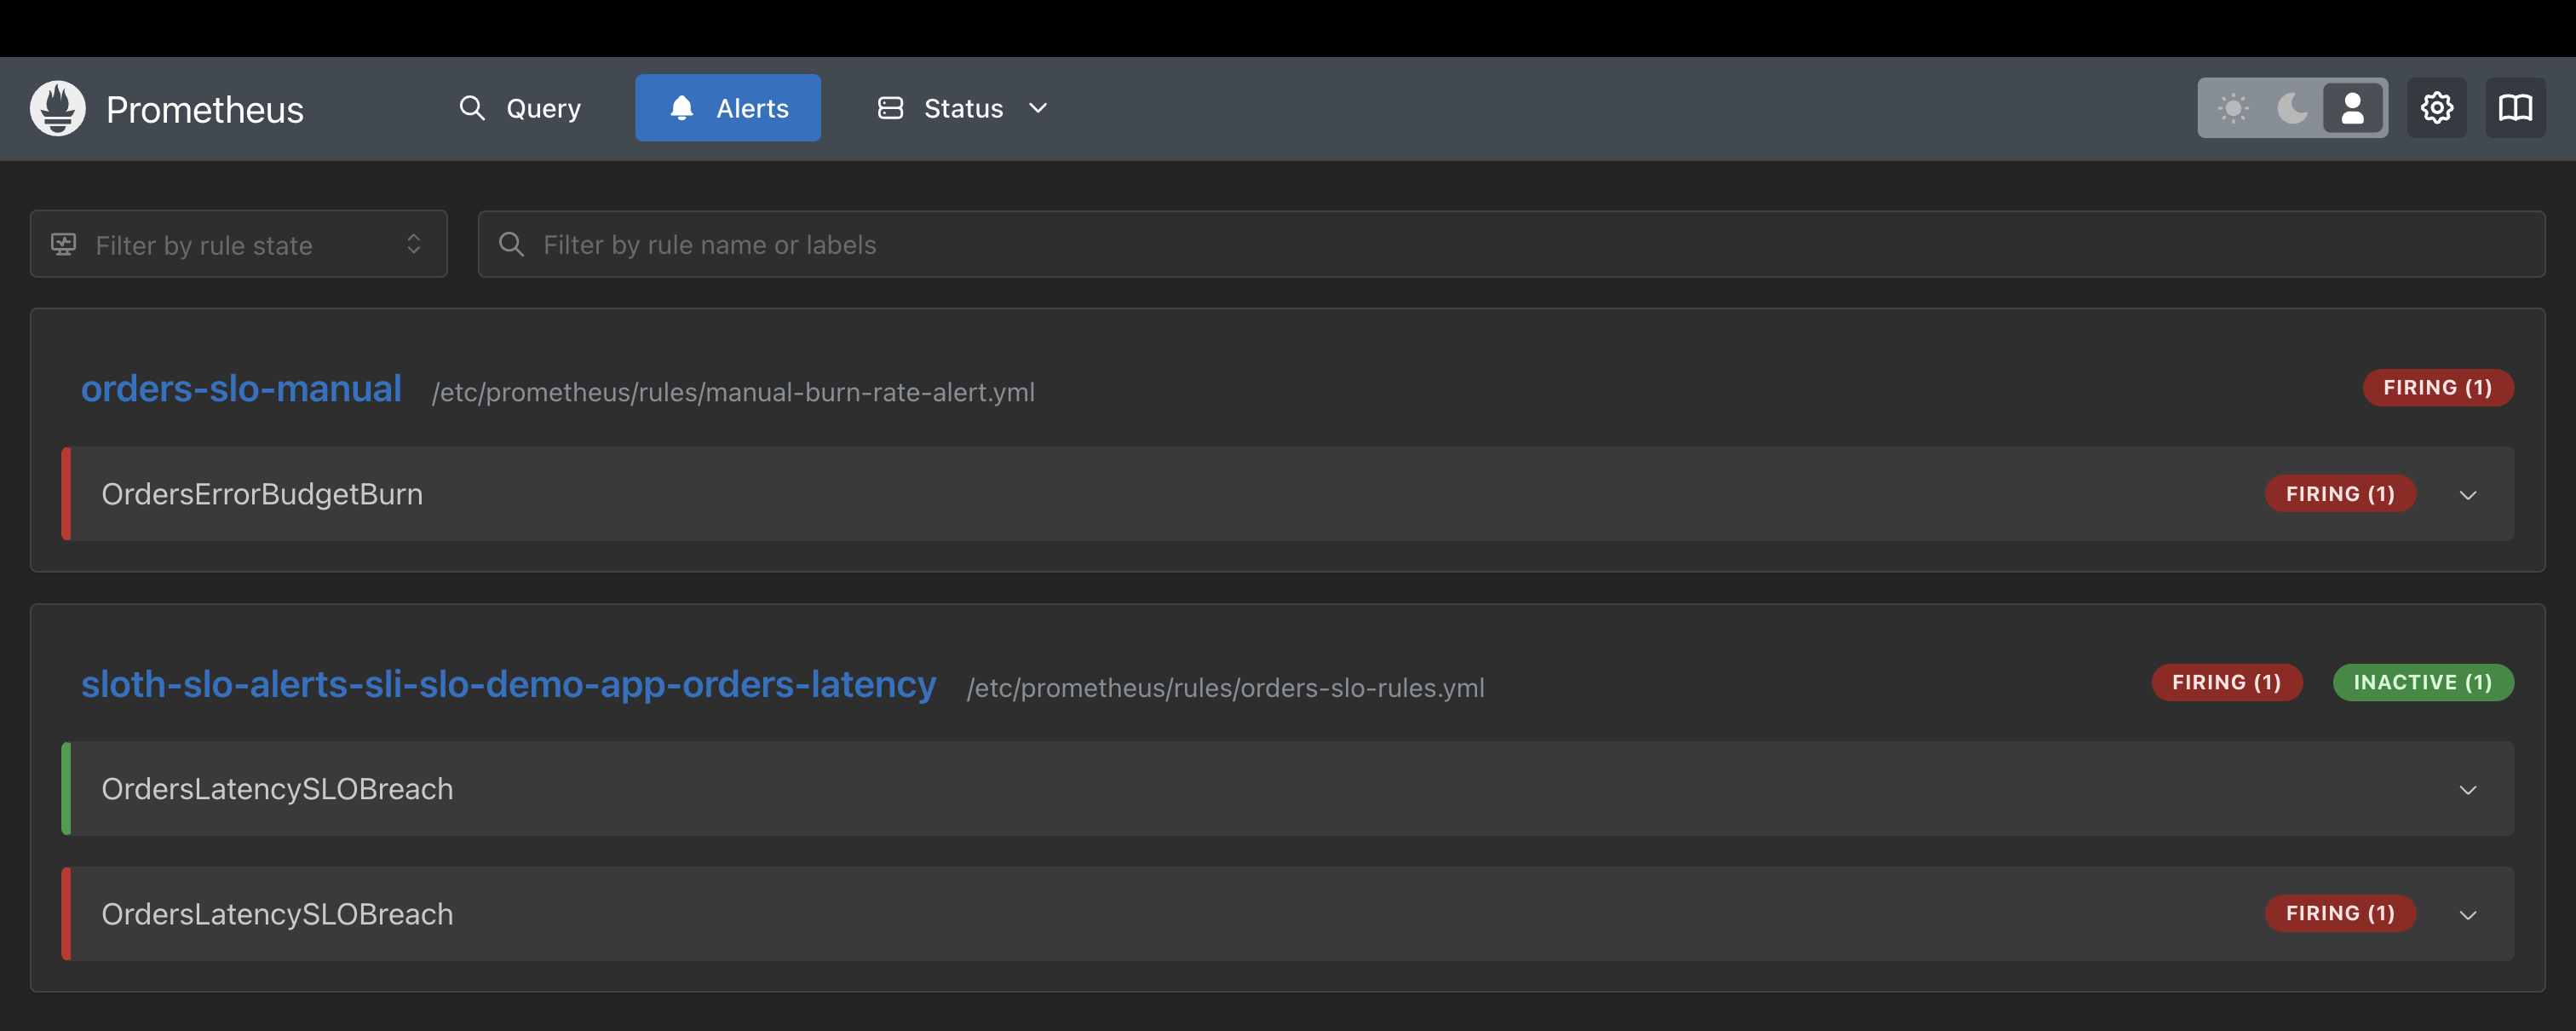
OrdersErrorBudgetBurn (my manual rule) and OrdersLatencySLOBreach (Sloth's generated rule) both FIRING. Alertmanager picked them up, waited its own group_wait: 30s, and sent real notifications. Realistic cold-start timeline: about 5-6 minutes of sustained breach before firing, then under a minute more to the actual email.
alertname = OrdersLatencySLOBreach
category  = latency
severity  = ticket
sloth_slo = orders-latency
summary   = /api/orders error budget burning too fast
And here's the actual email, in my actual inbox:
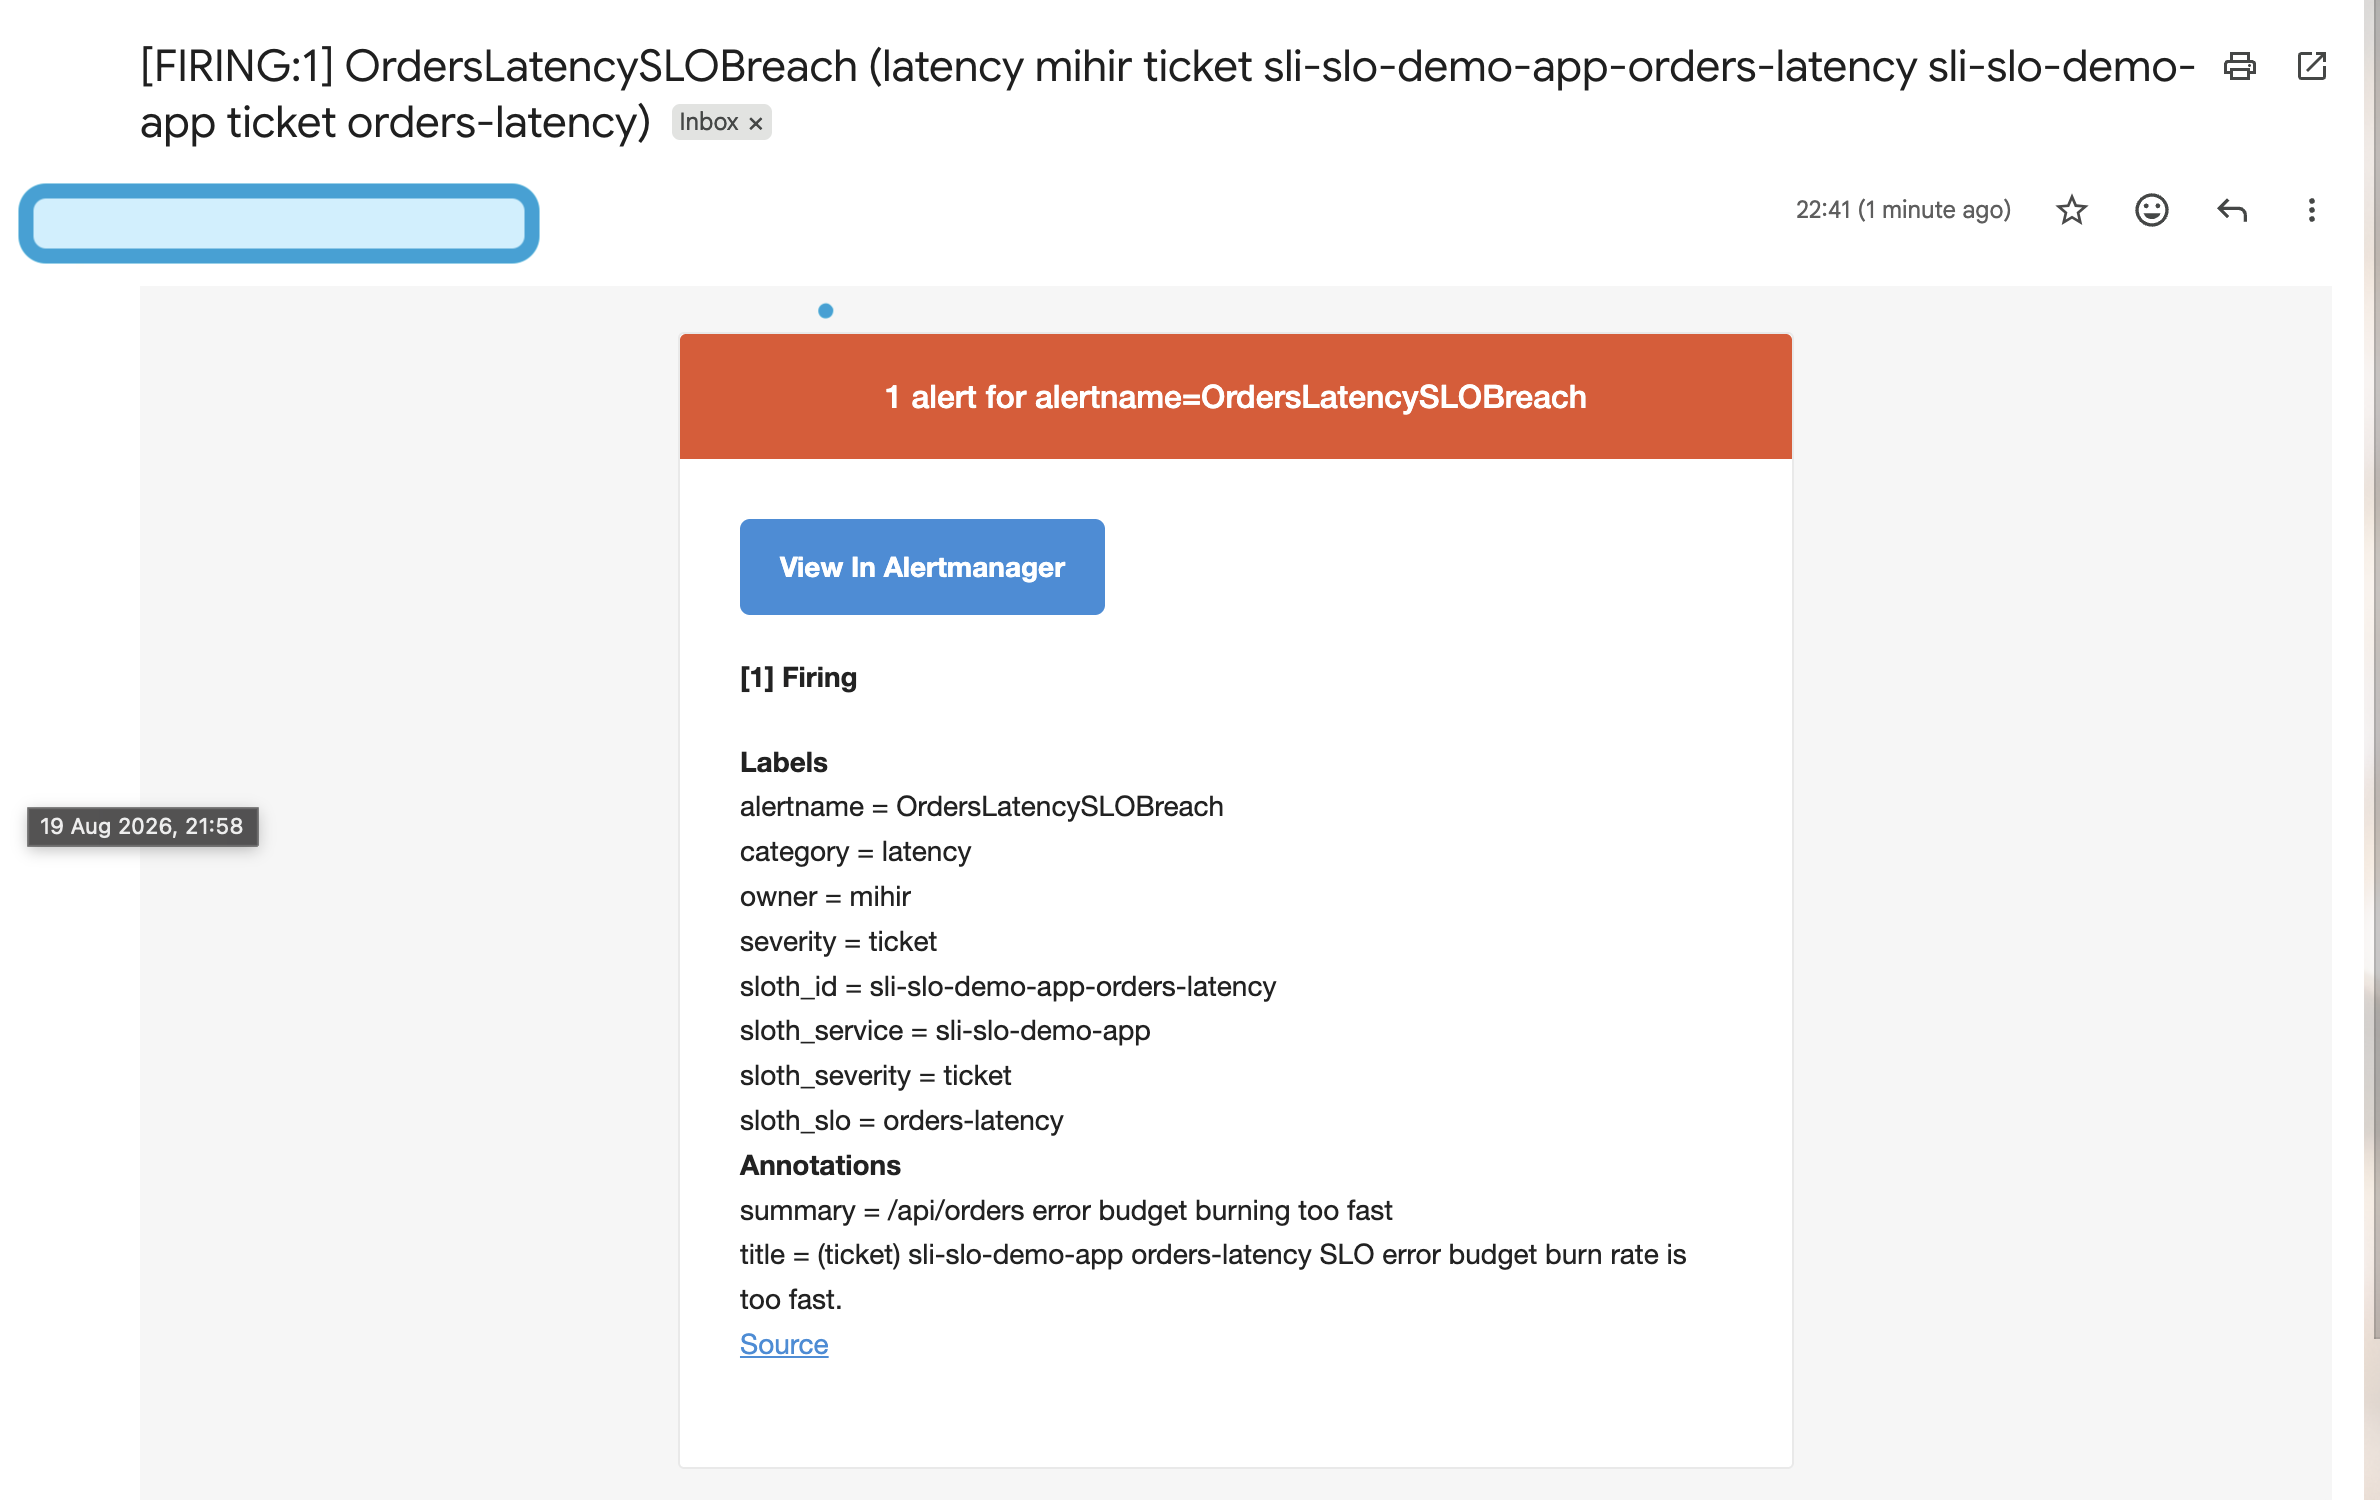
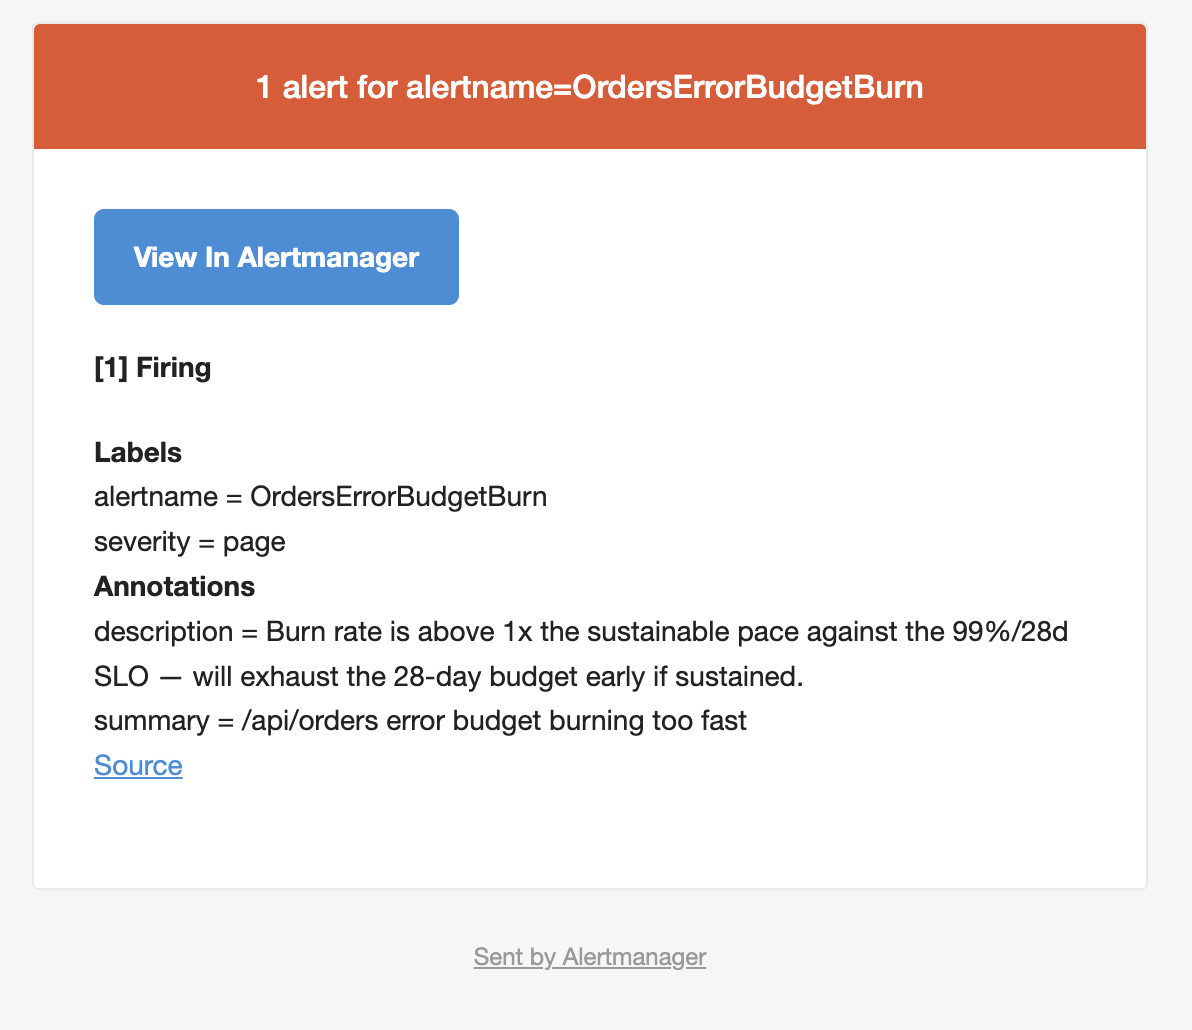
Two separate alerts, two separate emails, both routed through real SMTP by Alertmanager — not a mock, not a webhook logged to a console. This is the part that made the whole exercise feel real: the burn-rate math, the Sloth-generated rule, and the SMTP relay all had to actually work end to end for that email to exist.
Real bugs I hit building this
None of these were exotic — they're the exact class of problem that a vendor's managed pipeline exists to remove, which is worth sitting with for a second before jumping to the "just use Dynatrace" conclusion.
- Wrong metric names — the first PromQL panels queried metric names that didn't match what the OTel Collector was actually exporting. Caught by cross-checking
/api/v1/targetsoutput against the queries, not by staring at an empty panel. - Coarse histogram buckets — the default OTel histogram bucket boundaries didn't have enough resolution near the 500ms SLO threshold, which skewed
histogram_quantileresults. Fixed with an explicit OTelViewnarrowing the bucket boundaries around the threshold that actually matters. - A good/bad inversion in the SLO query — an early version of the success-ratio query had the numerator and denominator effectively swapped, so the dashboard showed a healthy-looking SLO while the app was actively failing it. This is the scariest bug in the list, because it fails silently in the "looks fine" direction.
- A float-formatted
lelabel — Prometheus histogram bucket boundaries are labeled with the bucket's upper bound (le), and a0.5boundary can render as"0.5"vs"0.500"depending on how it's generated, breaking exact-match joins in PromQL until the label format matched exactly. [5m]-window cold-start noise —histogram_quantile(..., rate(metric[5m]))divides a counter's increase by the window duration. Right after a restart, or right when traffic starts, that window is mostly empty, so the division producesNaNor a wildly skewed number — not an error, just silently wrong-looking data that self-resolves after a couple of minutes of real traffic. Easy to mistake for "the dashboard is broken" if you check it cold.- Alertmanager notification-log timing — re-running k6 against an alert that was already firing produced zero new emails, which looked like a bug but was
repeat_intervalworking exactly as designed: one continuous incident doesn't get re-notified until the interval elapses. To force a fresh notification without waiting it out, I had to either let the alert genuinely resolve and refire, or fully recreate the Alertmanager container (docker compose up -d --force-recreate alertmanager) — the notification log lives in the container's writable layer, and a plainrestartdoesn't clear it.
Every one of these is a "wrong metric name / wrong bucket / wrong query direction / stale cache" class bug — invisible plumbing that a vendor agent and managed backend just don't expose to you in the first place.
If this were Dynatrace instead
| This pipeline | Dynatrace equivalent |
|---|---|
telemetry.py manual OTel SDK setup, View boundary fixes |
OneAgent — auto-injected, discovers the process, instruments it with zero code changes |
| OTel Collector | Removed entirely — OneAgent talks straight to Grail, no intermediate collector |
| Prometheus (storage, PromQL, rule files) | Grail — proprietary storage/query engine, DQL instead of PromQL, no bucket-boundary tuning |
Sloth spec + sloth generate |
Built-in SLO configuration UI — fill in target %/timeframe, no YAML, no le label gotchas |
| Alertmanager (SMTP config, timer tuning) | Built-in Davis AI anomaly detection + notification integrations, no SMTP relay to debug |
| Grafana provisioning | Built-in dashboards, often auto-built before you write a query |
OneAgent isn't a Prometheus-style scraper, either — it's push-based. On Kubernetes it runs either as a privileged DaemonSet (one per node, Classic Full Stack) or via a mutating-webhook init-container injection per pod (Application Monitoring mode), which drops instrumentation binaries into a shared volume and hooks the app process via env vars (LD_PRELOAD, JVM equivalents) — no persistent sidecar, the injected code runs inside the app's own process.
Every bug in the section above — wrong names, coarse buckets, inverted queries, float-formatted labels, cold-window NaN, notification-log timing — is exactly the plumbing OneAgent's auto-instrumentation and Grail's managed storage remove by not exposing it to you at all. The trade: SaaS-only pricing, and DQL/Grail don't transfer to any other tool the way PromQL and OTel do.
If this were Datadog instead
Datadog is a genuinely different shape from Dynatrace, not just a rebrand — worth knowing before assuming "managed observability" means one architecture.
| This pipeline | Datadog equivalent |
|---|---|
| OTel SDK in app code | ddtrace APM library — or keep the same OTel SDK, point it at the local Agent's OTLP endpoint |
| OTel Collector | Datadog Agent — not removed like OneAgent, just swapped: still a local daemon you deploy and configure |
| Prometheus / PromQL | Datadog's backend, queried via its own syntax or built in the UI — more UI-driven than PromQL or even DQL |
| Sloth spec | Built-in Service Level Objectives — metric- or monitor-based, native burn rate |
| Alertmanager | Built-in Monitors + Watchdog anomaly detection — still has its own grouping/interval settings, just via a form |
The load-bearing difference: Datadog doesn't remove the local-agent layer the way OneAgent removes the Collector. The Datadog Agent runs as a DaemonSet, same shape as Dynatrace's Classic Full Stack mode — but the app still needs some instrumentation step. There's no equivalent of Dynatrace's zero-code init-container injection. Concretely, migrating this project to Datadog means deleting the OTel Collector and standing up a Datadog Agent DaemonSet, but telemetry.py survives almost unchanged — just point OTEL_EXPORTER_OTLP_ENDPOINT somewhere else. Genuinely smaller migration than the Dynatrace path, because Datadog kept the same three-tier shape (app → local daemon → backend) this project already has.
What I actually learned
Building the six pieces by hand is slower and uglier than a vendor trial, and that's precisely the point — the friction is where the understanding lives. A managed platform's whole value proposition is removing exactly the bugs I hit: wrong metric names, coarse buckets, inverted queries, float-label mismatches, cold-window artifacts, notification-log state. Having hit all six for real means I now know what I'm actually paying a vendor to make disappear, instead of taking their word for it.
The next step on this project is an actual Dynatrace trial pass against the same app, to see how much of this section changes from "here's the theory" to "here's what I watched happen."
Glossary
SLI (Service Level Indicator) — the actual measured metric, e.g. "% of /api/orders requests under 500ms." Just a number/ratio.
SLO (Service Level Objective) — the target for that SLI, e.g. "99% over a rolling 28 days." A promise, not a measurement.
Error budget — 1 − SLO objective. At 99%, 1% of requests are allowed to miss the target before the budget is "spent." Turns a vague uptime goal into a concrete, spendable quantity teams can make tradeoffs against.
Burn rate — how fast the error budget is being consumed relative to a sustainable pace. Burn rate of 1 = exhausting the budget exactly at the 28-day boundary. Burn rate of 5 = exhausting a 28-day budget in ~5.6 days if sustained.
Multi-window burn-rate alerting — the standard SRE-book pattern of requiring two burn-rate conditions to both be true (e.g., high burn over 1h and over 5m) before paging, to avoid alerting on a single short blip while still catching genuine fast-burning incidents quickly.
p50 / p95 / p99 — percentiles of a latency distribution. p50 (median) is the typical experience; p95/p99 are the tail — the worst 5%/1% of requests. Averages dilute a few very slow requests among many fast ones; percentiles don't. Most SLOs target p95 or p99, rarely p50, because p50 barely moves even when a meaningful slice of users is having a bad time.
NaN-on-cold-window — histogram_quantile(..., rate(metric[5m])) divides a counter's increase by the window duration. If the window is mostly empty (just restarted, or traffic just stopped), the result can be NaN or wildly skewed — not an error, just silently wrong-looking data that self-resolves once a full window of real traffic accumulates.
group_wait / group_interval / repeat_interval — Alertmanager's three timers. group_wait is the delay before the first notification for a new alert group. group_interval is how often a group is re-checked for new alerts joining it. repeat_interval is how long Alertmanager waits before re-sending the same still-firing alert — "I retriggered load and got no new email" is usually this timer working as intended, not a bug.
Pre-flight check — the sanity pass before trusting any dashboard result: confirm every container is actually up and reachable first. Catches "the whole stack is down" before wasting time debugging a query that was never going to return data.