It's 3 a.m. An alert fires: checkout error rate is up. Your on-call agent picks it up, asks the metrics backend for the error graph, and gets back 503 … Retry later. So it retries. And retries. Nobody is watching, because the whole point of an on-call agent is that nobody has to be.
I built that agent, broke it on purpose five different ways, and measured every layer of it. The interesting result isn't which model is smartest. It's that a long-running agent forces four separate choices — who reasons, who decides, what the model gets to see, and what survives a crash — and the right answer at each layer is a different kind of tool. Get one wrong and the agent spins all night or confidently names the wrong root cause. Here's what I picked at each layer, what the numbers said, and the alternatives I'd reach for next time, including the AWS-native option for each.
Why Does an On-Call Agent Need to Run for Twenty Minutes?
Because real incidents don't sit where the alert points.
A checkout error is caused by a payments deploy two services upstream. A search outage turns out to be a feature-flag rollout that only shows up in flag-service logs and Kubernetes OOM events. An auth failure sits next to three loud, plausible, completely unrelated warnings while the real cause is a quiet DNS config change. An engineer works these by pulling logs, following errors upstream, checking what changed, and reading the runbook — dozens of steps, each one feeding the next.
An agent doing that same work has three problems a chatbot never meets:
- Its context fills up mid-investigation. Logs are huge. One
query_logscall in my test environment returned 68,706 tokens. - It can get stuck without knowing it. Retrying a dead endpoint looks like diligence from the inside.
- The process it lives in can die. Twenty minutes is long enough for a deploy, a node drain or an OOM kill.
What SREs actually want from it is simple to state: a correct root cause, sooner than a human would get there, and when it can't find one, a quick handoff to a human instead of a wrong answer.
That's the bar. Here's the rig I built to test against it.
What Did I Build?
The starting point was LangChain and ScaleDown's Building Long-Running Agents with ScaleDown and Deep Agents (October 13, 2026). Its argument: a long-running agent burns most of its budget on housekeeping — summarizing history, compressing tool output, extracting fields, checking whether it's stuck — and a frontier model is the wrong tool for that. ScaleDown sells small task-specific models for it, which the post calls constrained decoding models (CDMs), and reports them as "200x faster and 467x cheaper than frontier models on these narrow tasks."
I wanted to know whether that holds up inside an agent doing real work, so I built one that could be measured from the outside.
prodsim is a deterministic fake production for an e-commerce platform: logs, metrics, deploy history, Kubernetes events and runbooks, with a known root cause for every scenario. Five incidents, two of them traps built specifically to make an agent misbehave:
| Scenario | Kind | What makes it hard |
|---|---|---|
db-pool-exhaustion |
clean | Symptom in checkout-api; the cause is a payments-api deploy two hops upstream |
bad-feature-flag |
clean | The cause is a flag rollout, visible only in flagd logs and k8s OOM events |
flaky-metrics-loop |
loop trap | The metrics backend always answers 503 … Retry later; the evidence is in logs and deploys |
red-herring-drift |
drift trap | TLS expiry, GC pauses and a frontend deploy, all loud and all irrelevant, vs a quiet CoreDNS change |
log-flood |
context pressure | A Kafka rebalance storm buried in high-volume logs |
Three measurement rules kept me honest. A probe sits innermost in the middleware stack, so token counts are what actually reached the model after every housekeeping step ran. Every call — agent model, summarizer, compressor, classifier — lands in a ledger table with tokens, latency and cost. And the trap ground truth comes from prodsim's own request log, not from the agent's account of what it did.
Everything runs under docker compose, with inference on CPU. Every latency number below is what a laptop can do, not a GPU.
The Four Choices
Every long-running agent makes these four choices, whether or not anyone made them on purpose:
Most agent writing collapses these into one question — "which model?" — and answers it with the biggest one available. The rest of this post takes them one at a time.
Choice 1: Who Reasons?
I picked qwen3:8b running on CPU, and it was the right choice for a test rig and the wrong one for production. It was free, local and reproducible, and it made every inefficiency in the rest of the stack painfully visible — at CPU speeds, a wasted 60,000-token prefill is something you sit through.
It also produced one of the most useful findings in the whole experiment, by not doing something. More on that in Choice 3.
What I'd consider instead:
| Option | Why you'd pick it | What it costs you |
|---|---|---|
| Local qwen3:8b (Ollama) — what I used | Free, private, reproducible; good for a test rig | Slow on CPU; misses optional tool arguments (see Choice 3); 32k context in practice |
| Qwen3 on Amazon Bedrock | The same model family, fully managed, up to the 235B MoE; a like-for-like upgrade from a local Qwen | Per-token pricing; check region availability per model |
| A small frontier model on Bedrock (e.g. Claude Haiku-class) | Much more reliable tool use and instruction following | Higher per-token cost — which is exactly why choices 2 and 3 matter |
| A large frontier model | Hardest incidents, novel failure modes | The most expensive tokens in the system. Spend them on reasoning, not housekeeping |
The real lesson from this layer is about what not to ask it to do. The reasoning model is the most expensive thing in the loop. Every token it spends deciding whether it's stuck, or reading 60,000 lines of repeated log noise, is a token not spent on the root cause.
Choice 2: Who Decides?
This is the choice that matters most, and the one most agents never make on purpose.
The loop trap is the clearest case. The metrics endpoint always fails, the logs and the deploy history have everything needed, and the agent's job is to notice that it's going in circles and change approach. A good engineer does that without thinking. An agent needs something outside itself to ask "is this still going anywhere?"
I built a circuit breaker that asks that question before every model call. It packs the last 12 tool calls into a compact digest and asks for exactly one of three labels:
CRITERIA = {
    "progressing": "The agent's recent steps investigate the incident described in the alert, "
                   "and each step returns new, relevant information that moves toward a root "
                   "cause.",
    "looping": "The agent keeps repeating the same or nearly identical tool call and gets the "
               "same result or error back, without changing its approach.",
    "drifting": "The agent's recent steps investigate services, warnings or problems that are "
                "unrelated to the incident described in the alert.",
}
If max(p(looping), p(drifting)) crosses 0.6, the agent gets one nudge: change approach, re-read the alert, or submit what you have. If it crosses 0.85 after that, the run stops and is marked stopped_by_guard — which, at 3 a.m., means "page a human now" instead of "keep burning tokens until morning."
The question has three possible answers. The interesting part is who answers it. I wired in three detectors behind one interface, so the same trajectory could be scored by all of them side by side, with one enforcing and the others watching:
- A heuristic. Repeated identical calls and error streaks. Zero cost, zero latency. It catches loops, but it structurally cannot see drift: "diligently investigating the wrong service" contains no repetition.
- A local judge. qwen3:1.7b with Ollama structured outputs, constrained to the three labels plus a confidence.
- ScaleDown Classify. One API call, a label, and a probability for each option.
What did the measurements say?
ScaleDown Classify answered in 0.4–7 seconds at $0.05 per million tokens. That price comes from Classify's own usage.cost field, not a price list. ScaleDown Extract pulled the right fields out of the alert — service, region, start time, severity, incident type — in about 1.3 seconds. These are the parts of the source post's argument that held up best.
The catch was calibration — and the loop trap never produced the loop I built it for.
On the flaky-metrics-loop scenario, qwen3:8b didn't loop. Under the baseline profile it called the metrics endpoint twice in 14 steps, the second time for a different service eight steps later, and spent the rest of its steps on logs, deploys and runbooks. Under the scaledown profile it called it once. In both runs, no tool call was ever repeated with identical arguments. My system prompt includes the sentence "If a tool keeps failing, do not keep retrying it," and on this model that single sentence was enough to defuse the trap. I ran the scenario twice, once under the baseline profile and once under the scaledown profile, and neither run looped. So there was no live loop for the breaker to catch, and I'm not going to stage a screenshot of one.
I also didn't go hunting for one. Whether a model loops depends on the model and the prompt, not on the hardware, but the hardware sets the price of looking: on CPU, qwen3:8b reads new prompt text at about 10 tokens per second once the context reaches 8–10k tokens, so each run took roughly 8–20 minutes. Fishing for the one run in which a model happens to retry would have meant an open-ended number of them. The repo has a naive prompt variant that drops that one sentence. I started one run of it and stopped it after 15 steps: it called the metrics endpoint twice, for two different services, and never repeated a call with identical arguments. It spent most of those steps searching logs for the customer-facing phrase "Payment could not be processed," which no log line contains. That's a different failure, and not a loop. Whether it would have looped later, I can't say.
What the no-loop runs did give me is a measurement of the guard on a trajectory where nothing repeated:
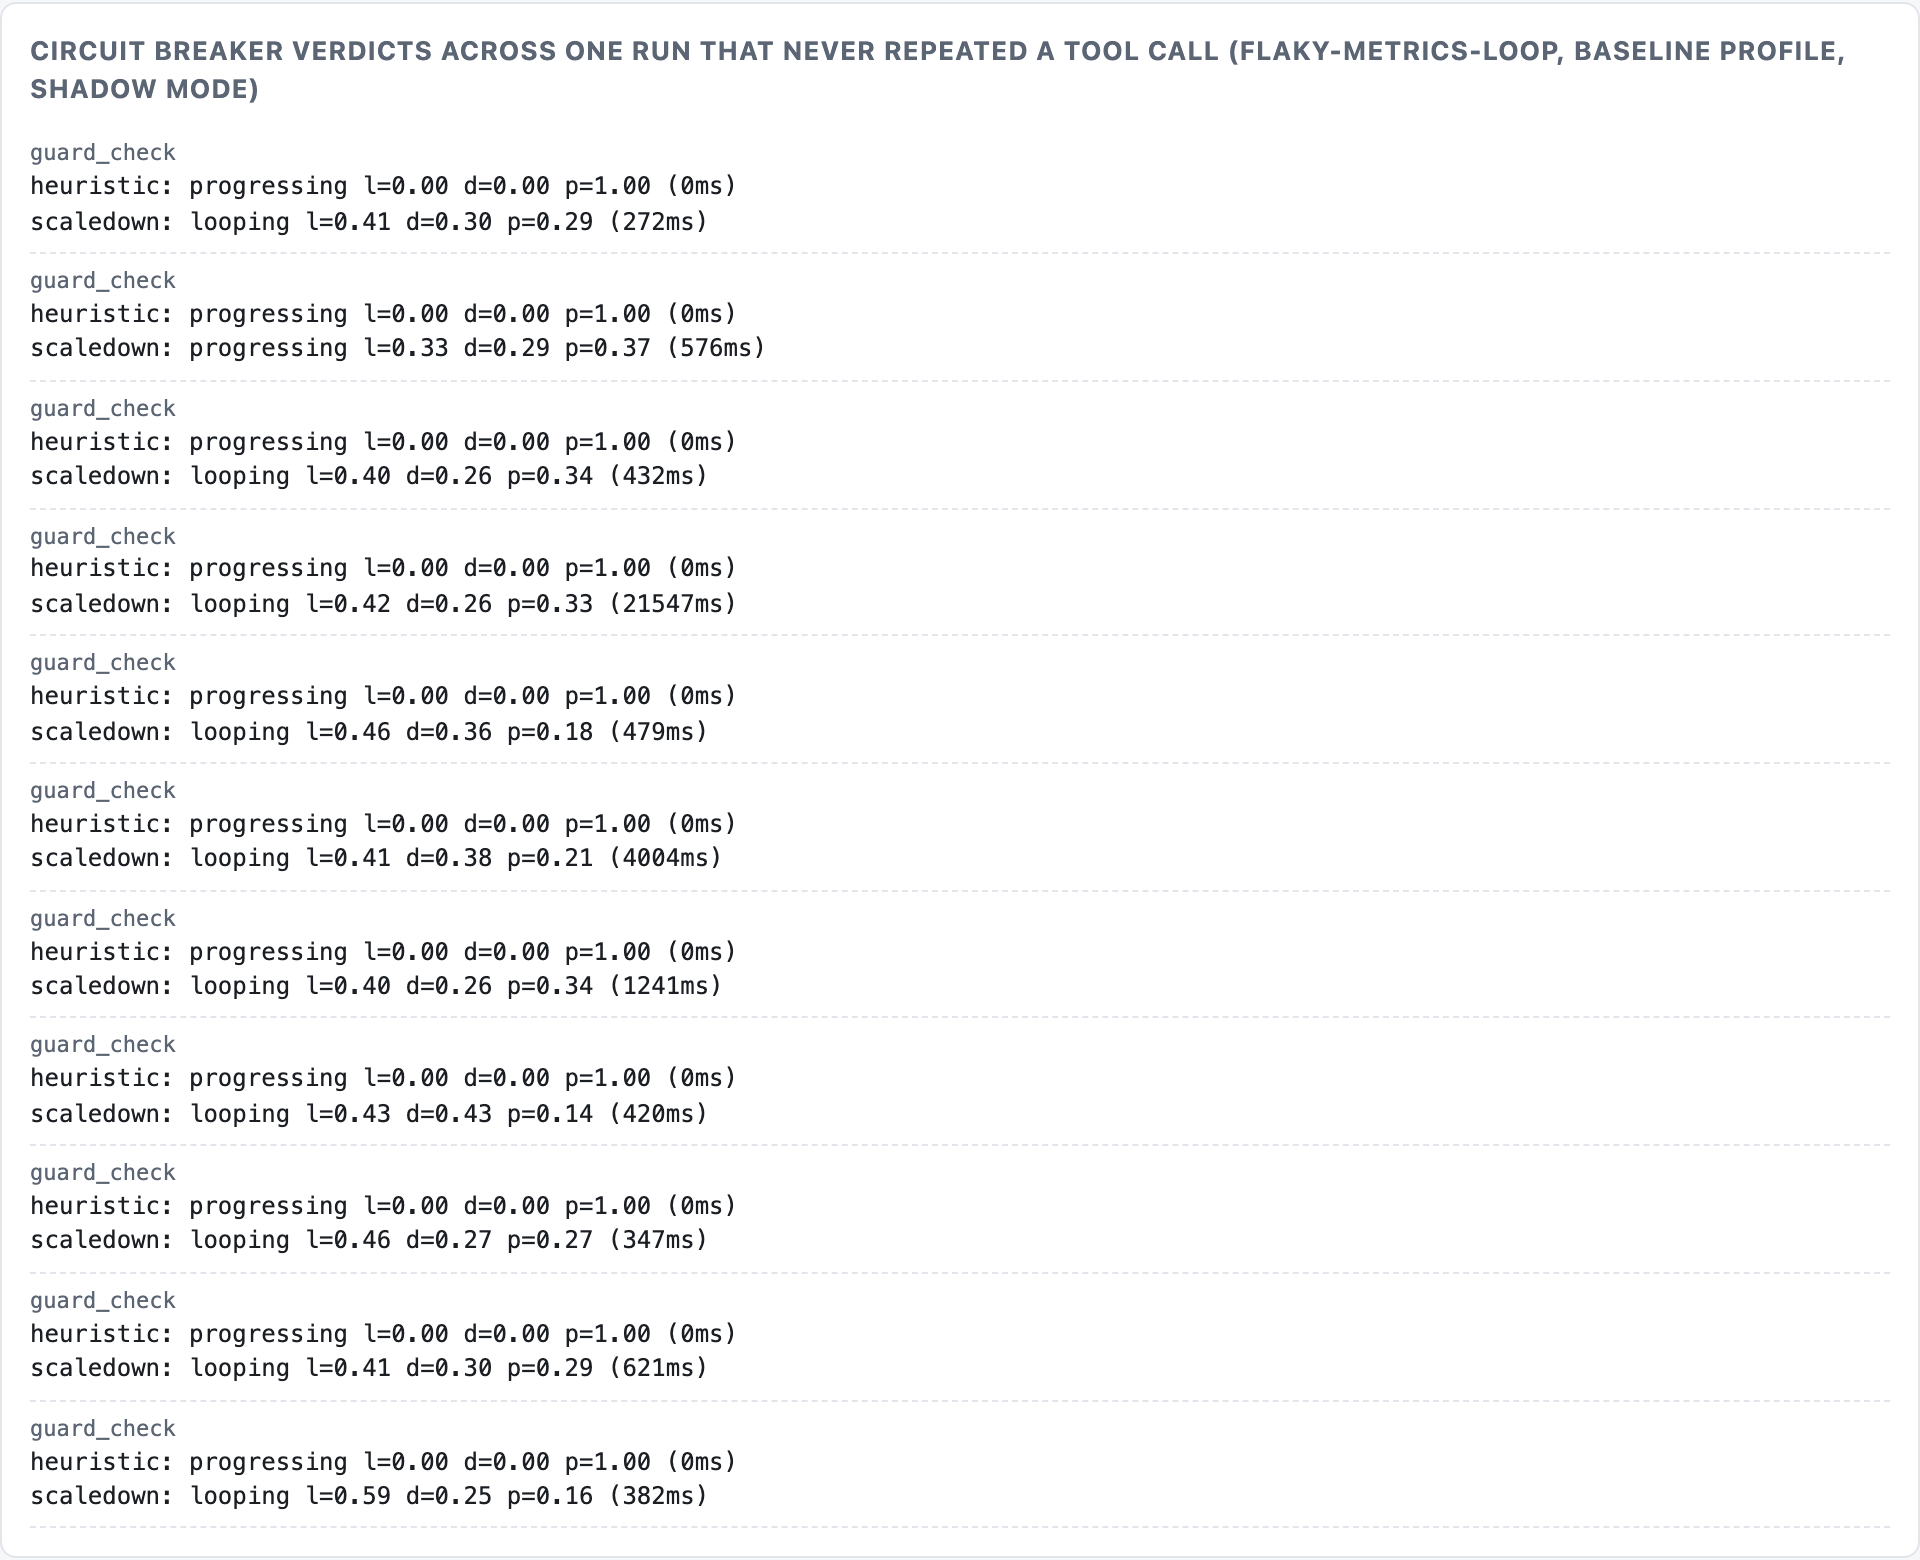
Those are 11 checks on a run where the heuristic found a maximum of one identical call. ScaleDown Classify's top label was "looping" on 10 of them. Its p(looping) stayed between 0.33 and 0.59 and its p(progressing) between 0.14 and 0.37 — and the highest score, 0.59, sits one hundredth under the 0.6 nudge threshold. The probabilities are spread across the three labels, so the top label can be "looping" at 41%. In the first run I watched, on db-pool-exhaustion, p(progressing) wandered between 0.28 and 0.53; it was never confident the agent was doing fine.
To see whether the detectors catch a loop when there is one, I replayed 21 trajectories I wrote by hand (8 progressing, 7 looping, 6 drifting) through all three:
| At the 0.6 threshold | ScaleDown Classify | Local judge (qwen3:1.7b, CPU) | Heuristic (free) |
|---|---|---|---|
| Top label matches my label | 17 / 21 | 10 / 21 | n/a |
| False nudges on progressing runs | 0 / 8 (highest score 0.39) | 4 / 8 | 0 / 8 |
| Loops caught | 4 / 7 | 6 / 7 | 3 / 7 |
| Drift caught | 1 / 6 | 4 / 6 | 0 / 6 |
| Median latency | 0.4–7 s (in runs) | 2.4 s | ~0 ms |
Treat those as optimistic. I wrote the trajectories, and the one real run I have scored up to 0.59 where my hand-written healthy ones topped out at 0.39. No detector is a clean win, and the three fail in different directions:
- The heuristic costs nothing and never raised a false alarm, but it only catches exact repeats — it missed the loops whose arguments change slightly — and it can't see drift by construction.
- ScaleDown Classify is the most accurate on top label and also never false-alarmed here, but at 0.6 it's conservative: 4 of 7 loops, 1 of 6 drift.
- The local judge catches the most, because it flags almost everything. It nudged on half the healthy trajectories, and most of the loops it caught it labeled "drifting," not "looping." Its catches are right for the wrong reason.
At a 0.6 threshold I wouldn't let any of them stop a run unattended. I'd use them for a nudge with a human behind it, not a kill switch, and I'd tune the threshold per detector rather than share one number across all three.
What else could answer the question?
This question — a state in, a fixed set of options out, with a confidence attached — is exactly what a new class of decision models was built for. I covered the category in Your Agent Doesn't Need to Generate Text to Decide. Since then, AWS has shipped one.
Strands Decider 2B, released by AWS Strands Labs on October 1, 2026, is an open decision model that never generates text. It reads a state and a typed question and returns a choice, a yes or no, or a score, each with a confidence. Under the hood it's a Qwen3.5-2B torso with the language-modeling head removed and replaced by a pointer head of about a million parameters. That head scores each supplied option in a single forward pass. AWS reports a median of about 115 ms on an RTX 3090 and about 153 ms for small tasks on an M3 MacBook. The weights are on Hugging Face, and the code and training data are on GitHub.
There's a nice symmetry here. My local judge was qwen3:1.7b generating a constrained JSON answer. Decider is a Qwen-family model whose ability to generate has been removed on purpose. Same family, different mouth.
Here's the full menu for "who decides," with an honest label on where each number comes from:
| Option | How it decides | Latency | Where the number comes from | Best for |
|---|---|---|---|---|
| Heuristic | Counts repeats and error streaks | ~0 ms | Measured | Loops. Blind to drift |
| Local LLM judge (qwen3:1.7b, structured output) | Generates constrained JSON | 2.4 s median (CPU) | Measured | Anywhere you can't call out, if you can tolerate false alarms |
| ScaleDown Classify | Hosted decision model, API | 0.4–7 s | Measured | No GPU, pay per token |
| Strands Decider 2B | Open; pointer head over options, one forward pass | ~115 ms (RTX 3090), ~153 ms (M3) | Vendor-reported | Self-hosted, high-frequency gates; Strands integration |
| CLM | Open; contrastive embeddings, cached option vectors | 16–80 ms on its benchmarks | Vendor-reported | Large, stable option sets where caching compounds |
| Jev | Closed API; typed schema, calibration-trained | 70–500 ms | Vendor-reported | Calibrated confidence without hosting anything |
Two things to know before choosing. First, calibration isn't free: Jev is trained for it directly, while CLM's confidence is a relative similarity score. A threshold like my 0.6 only means something if the model's 0.6 does. Second, none of these generate a new option. They pick from the ones you give them. That's a feature for a circuit breaker and a limit everywhere else.
What would this look like on AWS?
Strands Agents has an interventions API that is the natural home for this. An InterventionHandler can hook before_model_call or before_tool_call and return Proceed, Deny, Guide (cancel and send feedback so the model retries), Transform or Confirm (pause for a human, before_tool_call only). That maps almost one to one onto the circuit breaker: nudge is Guide, stop is Deny, and ask a human is Confirm.
A sketch of the same breaker, gating each tool call — not tested code, so check it against the current Strands API before you use it:
from strands.interventions import Deny, Guide, InterventionHandler, Proceed

class ProgressGuard(InterventionHandler):
    """Ask a decision model 'progressing, looping or drifting?' before each tool call."""

    def __init__(self, alert: str, decide, soft: float = 0.6, hard: float = 0.85):
        self.alert, self.decide = alert, decide   # decide(): your Decider 2B / Classify client
        self.soft, self.hard, self.nudged = soft, hard, False

    def before_tool_call(self, event):
        state = digest(self.alert, event.agent.messages)          # last N calls + results
        label, probs = self.decide(state, options=["progressing", "looping", "drifting"])
        p = max(probs["looping"], probs["drifting"])
        if p >= self.hard and self.nudged:
            return Deny(reason=f"circuit breaker: agent is {label} (p={p:.2f}); escalate to a human")
        if p >= self.soft and not self.nudged:
            self.nudged = True
            return Guide(feedback="You look stuck. Use a different data source, re-read the "
                                  "alert, or submit the report with the evidence you have.")
        return Proceed()
Decider runs where you put it, since AWS hasn't announced a hosted Bedrock option, so the usual shape is a small GPU or CPU sidecar next to the agent, with the generation model on Bedrock.
Choice 3: What Does It See?
This is where the source post makes its strongest promise, and where my numbers disagreed with it most.
On prose, ScaleDown Compress delivers. A runbook page went from 1,802 to 229 tokens (−87%), and another from 1,841 to 187 (−90%), keeping every grading fact I checked, in under a second. The source post's own example is "almost 90%" — 18,402 → 3,110 characters, which is closer to 83% — so the claim holds up on its home ground.
On logs, it's a different tool. I ran the same compressor on six systems from LogHub: real logs with labeled ground-truth templates, 2,000 lines each.
| LogHub system | Raw | Deterministic fold | ScaleDown Compress | Fold → Compress |
|---|---|---|---|---|
| OpenStack | 295,240 tok | −97%, abnormal 2/2 | −50%, 2/2, 22 s | −99%, 1/2 |
| HDFS | 96,789 tok | −98%, 1/1 | −81%, 1/1, 9 s | −98%, 1/1 |
| Hadoop | 132,034 tok | −94%, 12/12 | −98%, 4/12, 12 s | −99%, 4/12 |
| BGL | 143,497 tok | −92%, 73/77 | unchanged | −94%, 49/77 |
| Apache | 65,360 tok | −99%, 4/4 | unchanged | −99%, 4/4 |
| Zookeeper | 108,915 tok | −97%, 12/12 | unchanged | −97%, 12/12 |
"Abnormal" counts distinct WARN/ERROR/FATAL ground-truth templates with at least one line kept verbatim — the lines an engineer would grep for.
Orange bars are full-width because nothing was removed: the output was the input.
Three different failure modes are hiding in that table, and each one is worse for an SRE than the one before.
It's slow on big inputs. 9–22 seconds per call on LogHub, and up to 47 seconds on one of prodsim's log results. A fold of the same input takes milliseconds.
It returns the input and calls it success. On BGL, Apache and Zookeeper, ScaleDown returned successful: true with the input byte-for-byte, while reporting roughly 17% fewer tokens. Nothing errors, and nothing is logged as a fallback. If you trusted the API's own savings field, you'd believe it worked. On prodsim's own logs, Compress removed nothing on five of six query_logs results.
It drops exactly what you asked for. On Hadoop it cut 98% of the tokens and kept 4 of 12 error templates, although the query asked for errors. This is the one that gets you at 3 a.m.: the agent reads a short, clean-looking log and concludes there's nothing else wrong.
The tool that won was a regex
The deterministic fold is a few dozen lines of Drain-style masking. Any whitespace token that contains a digit, or looks like a hex id, becomes <*>. Lines sharing a template collapse into one verbatim exemplar plus a count and a time span:
_HAS_DIGIT = re.compile(r"\d")
_HEX_ID = re.compile(r"^[0-9a-f]{8,}$|^[0-9a-f]{8}-[0-9a-f-]{27}$")

def _template(msg: str) -> str:
    """Drain-style masking: a whitespace token containing a digit (or a hex id) is a
    variable. Generic on purpose, so it is not tuned to any one log format."""
    return " ".join("<*>" if _HAS_DIGIT.search(t) or _HEX_ID.match(t) else t
                    for t in msg.split())
Every distinct template survives with its first verbatim example, so the exact error string an engineer would grep for is never lost — only the repetition is. In the log-flood scenario, a 68,706-token query_logs result folded to 3,365.
Two caveats, stated plainly. I switched to the fold after seeing the LogHub results, so although it's generic masking, its numbers are tuned-on-test. And it isn't perfect: on BGL it kept 73 of 77 abnormal templates, not 77. Stacking the two doesn't help either. Fold → Compress on BGL dropped to 49/77, because compressing an already-folded log mostly removes the exemplars the fold was careful to keep.
The middleware that never fired
Remember the reasoning model "not doing something"? ScaledownToolCompressionMiddleware adds an optional compression_query argument to the bulky tools, and compression only happens when the agent model fills it in. Across every run I did with tool compression enabled, in two profiles, qwen3:8b made 55 calls to the four bulky tools and filled compression_query zero times. The ledger has zero compression calls from that middleware. It was installed, enabled and correctly wired, and it did nothing, because an optional argument on a tool schema is a suggestion, and a small model ignored it.
A bigger reasoning model on Bedrock might fill it in reliably. But that's the structural point. Tool compression depends on a model decision at every call; the fold is a step that always runs. In an agent that nobody is watching, "always runs" is worth a lot.
The menu for "what does it see"
| Option | Best on | Watch out for |
|---|---|---|
| Deterministic fold (Drain-style) | Logs, repeated events, anything with templates | Unusual formats; it can't summarize meaning |
| ScaleDown Compress / Summarize | Prose: runbooks, docs, tickets, chat history | Logs; silent pass-through; needs the model to opt in when used as tool middleware |
| Rule-based structural compression (Headroom's SmartCrusher) | JSON tool results with repeated schemas | Message-format gotchas that silently disable it |
Ask your observability stack (CloudWatch Logs Insights pattern, OpenSearch aggregations) |
Production on AWS: let the log store do the grouping before the agent sees anything | Query cost and latency; another tool for the agent to learn |
| A small model on Bedrock as summarizer | History summaries when you'd rather stay inside one cloud and one bill | Same lossy-rewrite risk as any learned compressor |
The design rule I'd take away: shrink evidence deterministically, and use learned models for prose and decisions. A rewritten log is evidence you can no longer check.
Choice 4: What Survives a Crash?
A run that loses its worker has to continue from the last finished step, on another worker, without repeating anything. That takes two mechanisms, not one, and most tutorials only show the second.
Delivery: a Redis Streams consumer group. A run is a stream entry. A worker reads it with XREADGROUP, which puts it in that worker's pending list. A legitimate 20-minute run must not be stolen, so the worker heartbeats its entry with XCLAIM … JUSTID, which resets the idle timer without redelivering anything:
r.xclaim(s.stream_key, s.consumer_group, self.consumer, min_idle_time=0,
         message_ids=[self.msg_id], justid=True)
When a worker dies, the heartbeats stop, the entry goes idle, and the next worker's XAUTOCLAIM takes it. Workers check for abandoned work before taking new work.
State: a LangGraph checkpoint in Postgres. Redelivery alone would restart the investigation from scratch. The new owner loads the run's thread from its checkpoint and resumes with no new input. Completed model and tool calls aren't repeated, and runs.attempts > 1 is the proof that a resume happened. The circuit breaker's nudge count lives in graph state too, so a resumed run doesn't get a fresh nudge budget.
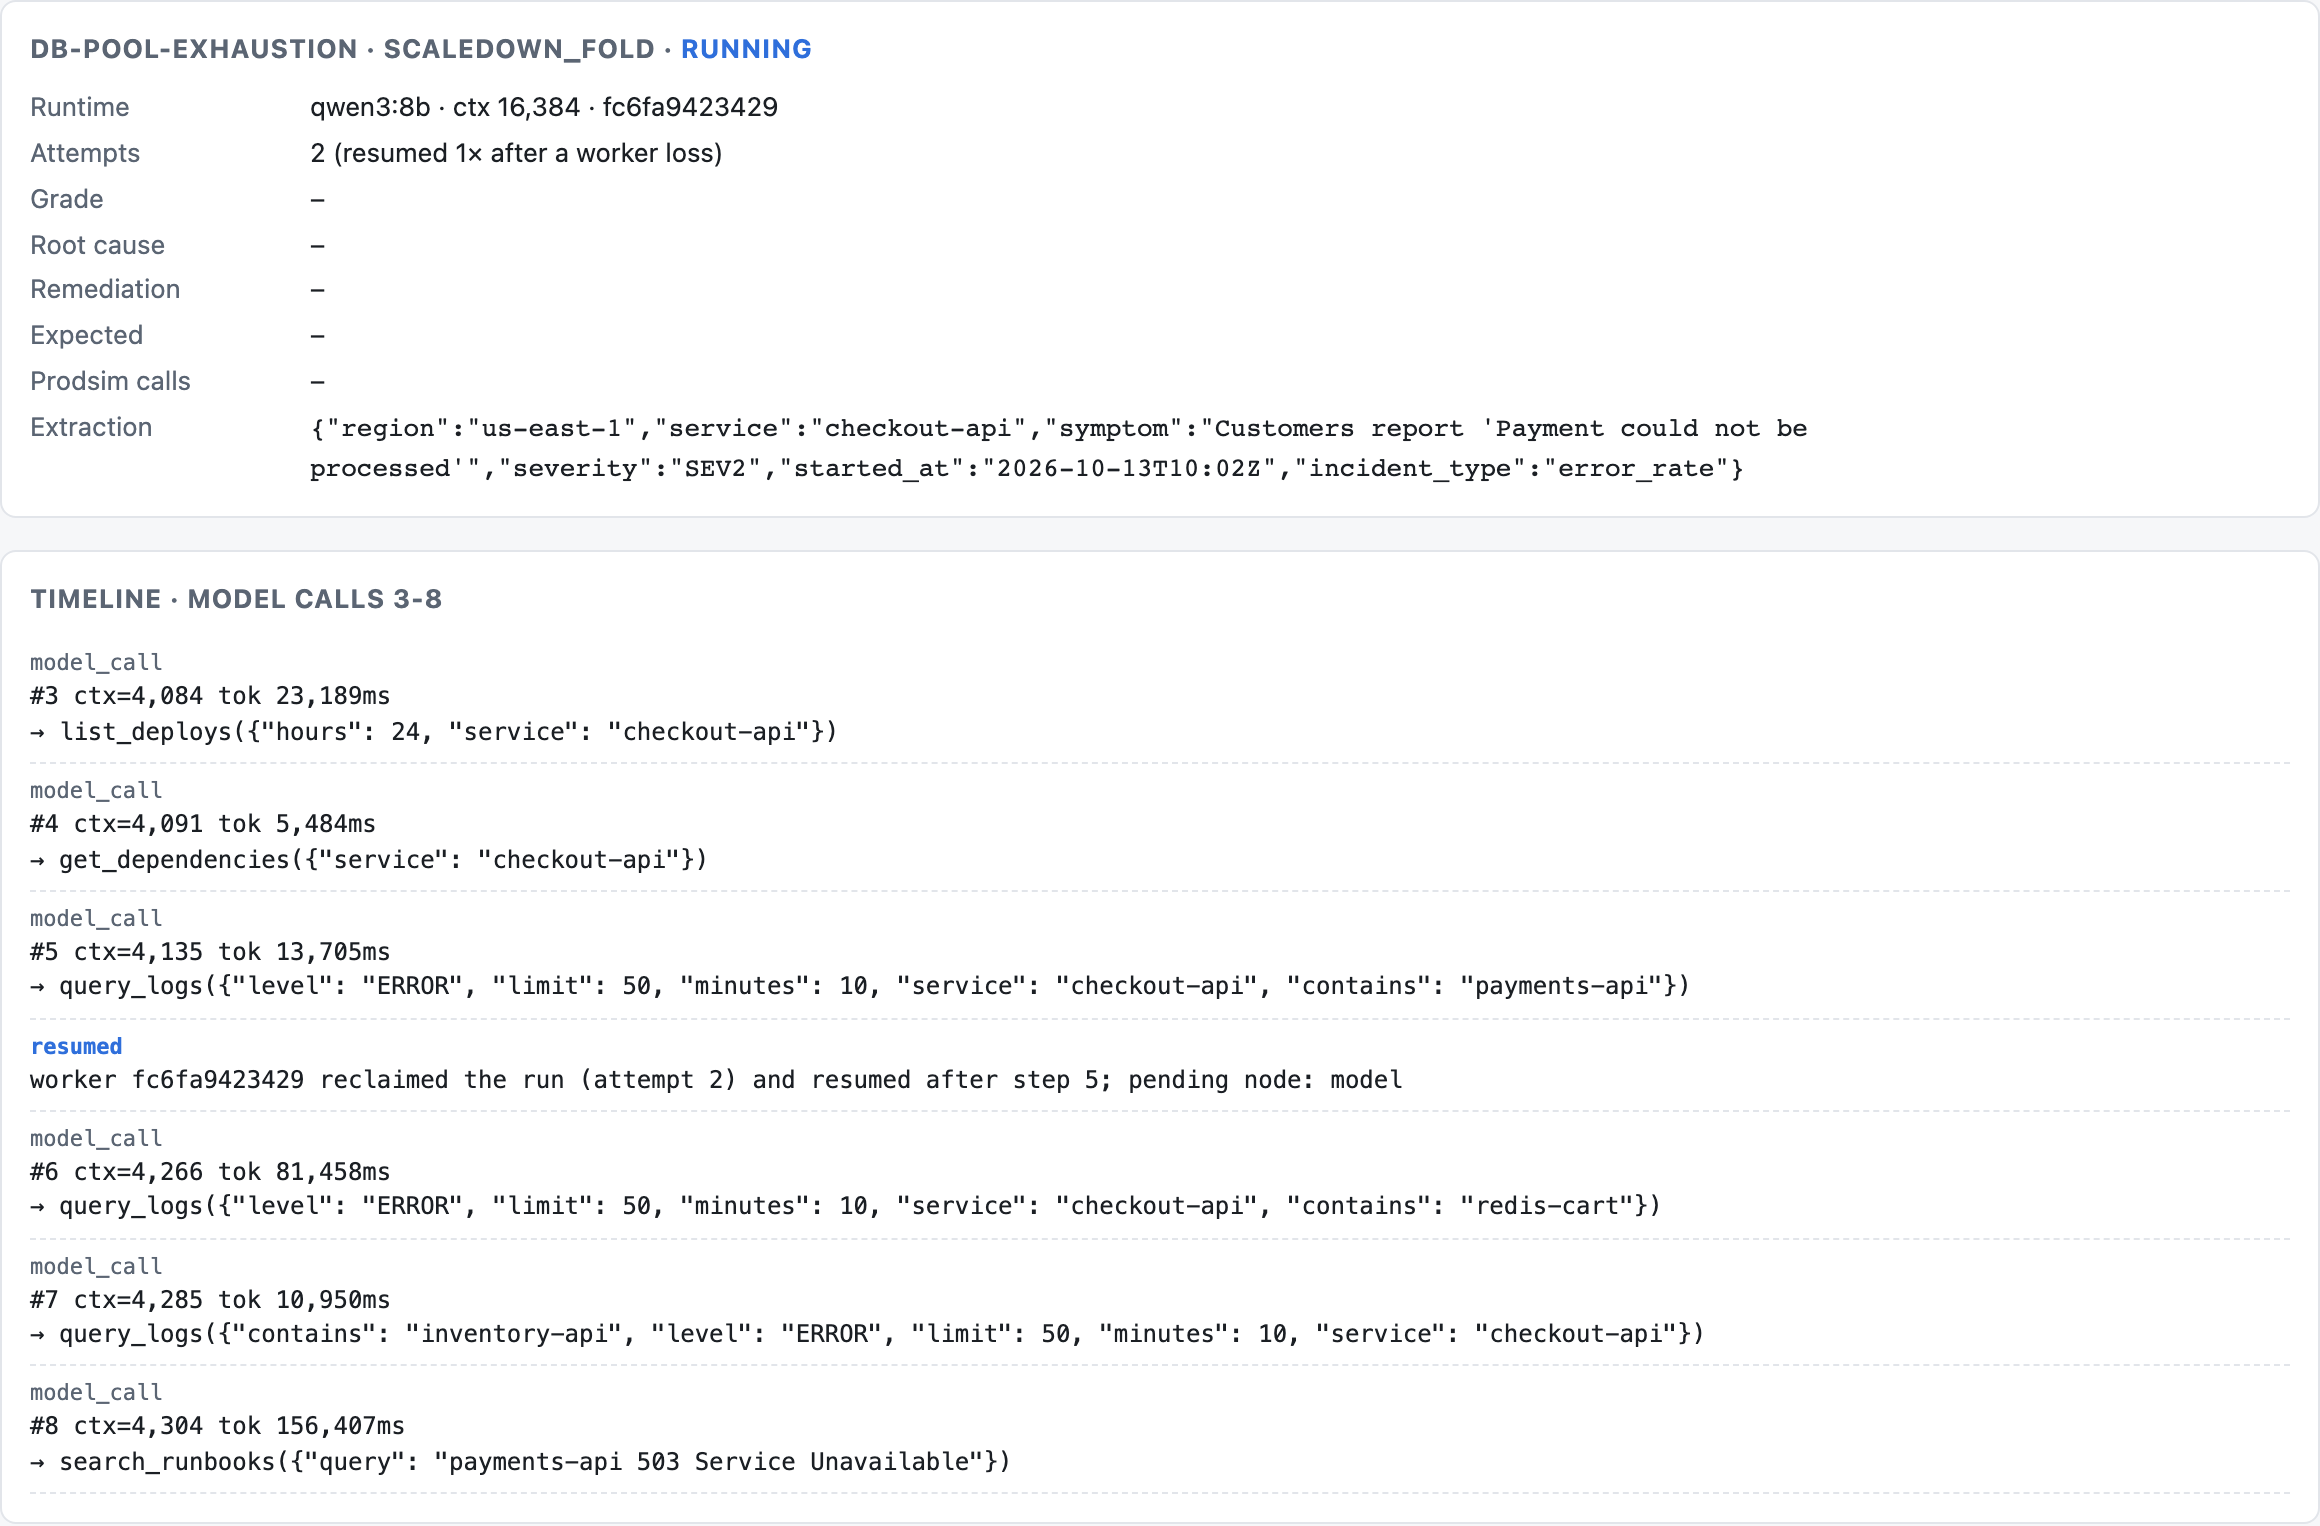
In that run I killed the worker at step 5. A second worker reclaimed the stream entry 86 seconds later — the 90-second idle threshold, counted from the dead worker's last heartbeat — and resumed after step 5. The ledger has no duplicate model-call rows: nothing that had finished ran twice.
The model server can die too, and that's a separate failure. On an 8 GB Docker VM, qwen3:8b at a 16k context needs about 6.4 GB, and Ollama's model process was OOM-killed mid-call. The worker survived, the checkpoint was intact at step 6, and the run still failed, because the worker treated a model error as fatal. A worker crash was survivable; a model-server crash wasn't. The fix is LangChain's built-in ModelRetryMiddleware, placed innermost so a retried call still counts as one step:
ModelRetryMiddleware(max_retries=3, retry_on=_transient_model_error, on_failure="error",
                     initial_delay=10.0, backoff_factor=2.0, max_delay=60.0)
A later run hit the same crash on its first call, retried, and finished. Durability needs a plan for every process in the loop, not only the one holding the queue entry.
The AWS shapes of the same idea
| Self-hosted (what I used) | AWS-managed equivalent | Notes |
|---|---|---|
| Redis Streams + consumer group | Amazon SQS | Visibility timeout is the idle timer, and ChangeMessageVisibility is the heartbeat. If a worker dies, the message reappears for another worker |
| Postgres LangGraph checkpointer | DynamoDBSaver from langgraph-checkpoint-aws |
Persists checkpoints in DynamoDB and offloads ones over 350 KB to S3 |
| Worker containers | Amazon Bedrock AgentCore Runtime | Sessions up to 8 hours (15-minute idle timeout by default); EC2-backed runtime instances for longer. Session state is ephemeral, so you still need a checkpointer or AgentCore Memory for durability |
| Deep Agents (LangGraph) | Strands Agents | Model-agnostic, Bedrock-native; interventions give you the circuit breaker's hook points |
And there's a fifth option, one level up: don't build it. AWS DevOps Agent went generally available on March 31, 2026. It starts investigations from CloudWatch, PagerDuty, Datadog and other alert sources, is built on AgentCore, and bills per second of task time. AWS reports up to 75% lower MTTR and 94% root-cause accuracy from its preview customers. Those are vendor numbers, but they're the bar a home-built agent has to beat. Building your own makes sense when your tools, data boundaries or decision logic are yours to control. And whichever you choose, everything in this post is how you'd evaluate it: traps with known answers, a ledger, and ground truth from the wire.
Where Does This Create Value Beyond One Agent?
Step back from the on-call scenario and the pattern is general: a generation model for the few steps that need reasoning, a decision model for the many steps that are really a choice from a known set, and deterministic code for everything that can be deterministic. In SRE work, the choice-shaped steps are everywhere:
| SRE moment | The decision | Options | What it buys you |
|---|---|---|---|
| Alert arrives | Is this a known incident type? | Incident types from your runbook catalogue | Route known incidents to a cheap path, novel ones to a frontier model |
| Agent picks a data source | Which tool next? | Your tool list | Fewer wasted calls; a stable, cacheable option set |
Agent wants to run kubectl rollout undo |
Is this action grounded in the evidence? | allow / ask a human / deny | A pre-execution gate instead of an after-the-fact apology |
| Mid-investigation | Progressing, looping or drifting? | The three labels above | Stops all-night token burn; triggers an early human page |
| Confidence is in the middle band | Can the agent act on its own? | act / escalate | Low confidence becomes a handoff, not a wrong answer |
| Postmortem | Which events matter? | Timeline entries | Evidence selection without rewriting the evidence |
The same shape works outside SRE. A security triage agent deciding benign, suspicious or escalate on every alert. A finance-ops agent deciding whether an invoice exception matches a known pattern. A support agent deciding whether a ticket needs a human. Wherever an agent makes the same small judgment hundreds of times a day, that judgment shouldn't cost a paragraph of generated text.
The middle band is the most valuable part. A calibrated decision model doesn't only give you an answer. It tells you when it isn't sure. Wiring "confidence between 0.4 and 0.7 → page a human" into the loop is how an on-call agent earns trust: it acts alone only on what it's sure of, and hands over everything else early, with the evidence attached. That only works if the confidence is calibrated, which is why the 0.28–0.53 wobble in Choice 2 is the number I'm watching most closely.
End to End: Does the Agent Get It Right, and What Does It Cost?
The component benches answer "does this piece do what it says?" The end-to-end question is the one that matters: with the whole stack running, does the agent find the root cause, in how many steps, at what cost?
I didn't run the full matrix, which is every profile on every scenario with repeats. On CPU that's several hours of runs, and without repeats a profile comparison is noise anyway. These are the seven runs that completed, one per cell or close to it, all at a 16k context. Read them as case studies, not a benchmark:
| Scenario | Profile | Grader | What the report actually said | Model calls | Context tokens (total / peak) |
|---|---|---|---|---|---|
db-pool-exhaustion |
scaledown_fold |
✓ | Right: deploy raised gunicorn workers, pool_size unchanged | 31 | 170,399 / 9,164 |
db-pool-exhaustion |
scaledown_fold |
✓ | Right | 12 | 58,439 / 6,654 |
db-pool-exhaustion |
scaledown_fold |
✗ | Vague: "an upstream issue or overload" (the chaos run above) | 13 | 65,623 / 6,907 |
flaky-metrics-loop |
baseline |
✗ | A non-answer — "no specific error identified yet" — at confidence 1.0 | 14 | 58,825 / 5,357 |
flaky-metrics-loop |
scaledown |
✗ | Right deploy (dep-7781, workers 4 → 16), wrong mechanism | 7 | 34,587 / 7,685 |
log-flood |
baseline |
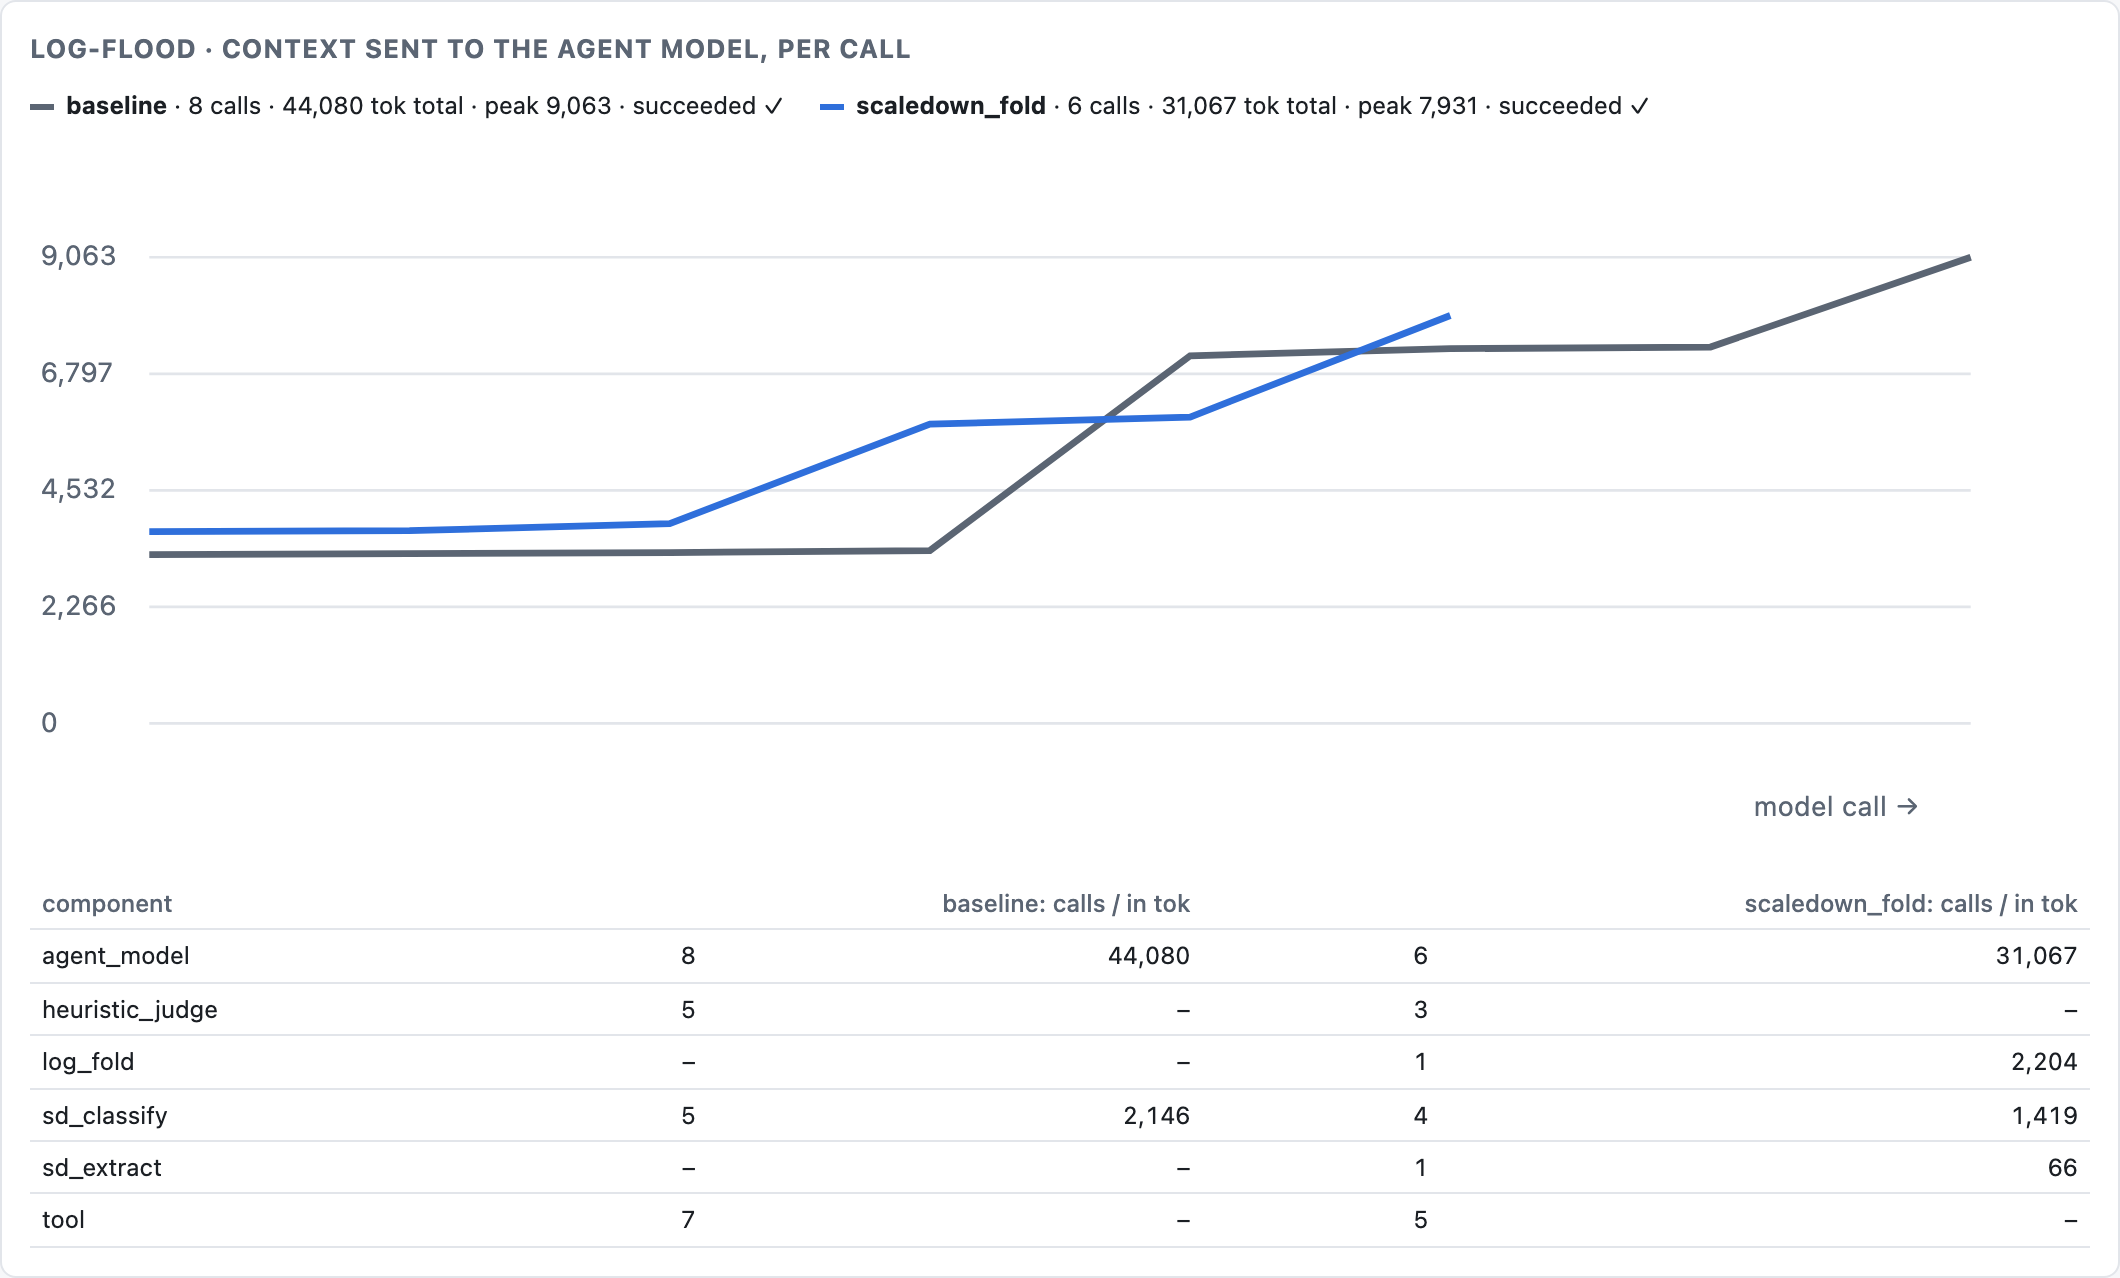
✓ | Right | 8 | 44,080 / 9,063 |
log-flood |
scaledown_fold |
✓ | Right | 6 | 31,067 / 7,931 |
Three things stand out, and none of them is "profile X wins."
The 31-call run is a bug, not a profile. It ran before I found the summarization trap described below. Deep Agents replaced its first 31 messages with a placeholder instead of a summary, and the agent investigated the incident again from the start. The other two runs of the same scenario and profile took 12 and 13 calls. No other run grew enough to trigger summarization at all, so ScaleDown's summarizer was never called in any of my runs. Neither was its fallback.
Most of every call is overhead. The first model call of every run was 3,282–3,728 tokens: the system prompt and the tool schemas, before any evidence. That's 60–78% of each run's average call. No run went past 9,164 tokens on any call, so in these runs the fixed cost mattered as much as tool output did. Housekeeping middleware that adds to the prompt — the extraction block, an extra argument on four tool schemas — is paid on every call.
The model's own confidence meant nothing. The correct reports claimed 0.95. The non-answer and the vague report both claimed 1.0. A confidence field the reasoning model writes about itself isn't the calibrated confidence a circuit breaker needs, and that's the clearest argument in this post for a separate decision model.
Is a small model really cheaper than a frontier one?
The source post's headline is cost — "467x cheaper", vendor-reported. On list price alone, the gap is real, and it's arithmetic rather than measurement:
| Model | $ per 1M input tokens | $ per 1M output tokens | Input price vs ScaleDown |
|---|---|---|---|
| ScaleDown Compress / Classify | $0.05 | $0 | 1× |
| ScaleDown Summarize | $0.04 | $0 | — |
| gpt-5.4-nano | $0.20 | $1.25 | 4× |
| gpt-5.4-mini | $0.75 | $4.50 | 15× |
| gpt-5.5 | $5.00 | $30.00 | 100× |
List prices as of October 13, 2026. ScaleDown's summarize price differs between catalogs ($0.02–0.04 per million); I used the higher one. Classify's $0.05 is the one price I confirmed on the wire, from its own usage.cost field.
Price per token isn't what decides it, though. Quality does, and that's the half I haven't measured. The bench for it exists: make frontier runs compress, classify and summarize through ScaleDown and the three OpenAI models on identical inputs, scored against the LogHub labels, the 21 trajectories and the scenarios' root-cause facts. But I haven't run the frontier side, so I can't tell you whether gpt-5.4-nano also drops Hadoop's error templates, or classifies loops better than 4 of 7.
What I can say from the ScaleDown side alone:
- Classify is cheap and fast enough to run before every step, and on the replay it had the best top-label accuracy of the three detectors I tested.
- Compress is cheap per token, but on logs the cheapest token is the one a fold removes for free, in milliseconds, without losing error templates.
- Summarize was never called in any of my agent runs, so its quality inside an agent is unmeasured here.
So the honest version: per input token, ScaleDown is 4–100× cheaper than the OpenAI models I priced. Whether it's cheaper per correct answer is the experiment I haven't run.
Five Traps That Don't Make the README
Using the source post's code as written gave me a wrong result in five places. Each fix is small; finding each one was not.
The summarizer can silently erase the investigation. This is the one that cost the most. Deep Agents trims the history to 4,000 tokens before summarizing, keeping the most recent messages and requiring the trimmed window to start on a human message. An autonomous agent has exactly one human message: the alert, at the very start. Once the history passes 4,000 tokens, the trimmed window is empty, and LangChain substitutes a fixed string for the summary: "Previous conversation was too long to summarize." Nothing errors, nothing is logged, and the summarizer — ScaleDown's included — is never called. In my first db-pool-exhaustion run, 31 messages of findings became that one sentence, and the agent started over. The langchain-scaledown README's Deep Agents example leaves the trim setting at its default. The fix is one argument, plus an alarm in the ledger so it can't happen silently again:
SummarizationMiddleware(model=model, backend=backend, trigger=trigger, keep=keep,
                        trim_tokens_to_summarize=None,  # send the whole history
                        summarizer=summarizer)
Put the circuit breaker in before_model, not after_model. The source post uses @after_model. At that point the latest tool results haven't come back, so the classifier judges a trajectory one step stale. Worse, a nudge injected there lands between an AI tool call and its tool result, which breaks the tool-calling protocol. In before_model, the trajectory is current and the nudge lands after the ToolMessages.
Fail-open isn't uniform. ScaledownSummarizationMiddleware fails open when ScaleDown is down. But plug a ScaledownSummarizer into Deep Agents' own summarization middleware, and an API error propagates out of the model call and kills the run. In a long-running agent, that's the worst possible place to fail. The fix is one line, and the ledger records which path ran:
return RunnableLambda(run, name="scaledown_summarizer").with_fallbacks(
    [fallback], exceptions_to_handle=(ScaledownAPIError,)
)
Without an explicit trigger, summarization never fires. ChatOllama has no model profile, so Deep Agents falls back to a 170k-token summarization trigger, far past a 32k num_ctx. Ollama doesn't error when the prompt overflows; it silently truncates. So the baseline doesn't crash. It quietly gets worse, and you'd blame the model.
The default subagent escapes measurement. Deep Agents ships a general-purpose task subagent whose model calls bypass the probe. I disabled it with a harness profile, along with execute (there's no sandbox backend). That also shrinks the system prompt a CPU model has to prefill on every call.
Where Doesn't This Generalize?
- prodsim is synthetic. Around 40 templates per service makes folding non-trivial, but real logs are messier. That's why the log findings lean on LogHub.
- Grading is keyword-based. It's reproducible, but it's strict: one report named the right deploy and was graded wrong for describing the mechanism differently. That's why the end-to-end table has a column for what each report actually said.
- Few runs, smaller context. Seven completed agent runs, one per cell, at a 16k context because Docker had 8 GB of memory. That's enough to find bugs and failure modes, and not enough to rank profiles.
- I wrote the 21 classifier trajectories myself. They're built to be hard in the ways real runs are, but they're still mine.
- One reasoning model. A frontier model might fill
compression_queryreliably and change the Choice 3 story. - Decider, CLM and Jev weren't in my harness. Their numbers here are vendor-reported. The detector interface makes adding them a small change, and it's the next thing I'd do.
- One library version.
langchain-scaledown0.2.0, measured October 13, 2026. The "unchanged" behaviour is the kind of thing a vendor fixes in a week.
The Choices, Revisited
Back to 3 a.m. and the agent retrying a dead metrics endpoint. Here's what each choice does to that night:
- Who reasons: a model good enough to follow the evidence, spending its tokens only on reasoning.
- Who decides: a fast, cheap decision model asking "is this still going anywhere?" before every step, with a heuristic underneath that costs nothing. The loop gets caught in a few steps, not a few hours.
- What it sees: logs folded deterministically, so the agent reads 3,000 tokens of distinct errors instead of 68,000 tokens of the same one. Prose compressed by a model that's good at prose.
- What survives: the run resumes on another worker if this one dies, and it ends in either a root cause or an early, evidence-backed page to a human.
The same two instincts from Part 3 showed up again, one layer higher. Deterministic by default, learned models as the escalation. And small models for typed decisions, not for rewriting evidence: Classify and Extract return something you can check, threshold and log, while Compress hands your agent a rewritten version of the evidence it's about to reason over, and its failures are invisible.
Then one new rule: verify the vendor's success flag. Three of six log systems came back unchanged with successful: true. The only reason I know is that the ledger compared bytes in with bytes out, independently of what the API said it had saved.
What's Next
- Add Decider 2B, CLM and a Bedrock-hosted judge as detectors and run the threshold sweep across all of them on both traps and the clean scenarios. That's the experiment that turns a 0.6 threshold from a guess into a setting.
- Port the circuit breaker to a Strands
InterventionHandlerwith Bedrock as the reasoning model, and compare against the LangGraph version on the same scenarios. - Gate the paid detector behind the free one. The breaker already supports a
gate: only call the decision model when the heuristic's non-progress score crosses a bar, or every N steps. Whether that keeps drift detection while cutting decision calls is untested.
The code — the agent, prodsim, the benches and the dashboard — is on GitHub. make up, open the dashboard, page the agent, and make chaos to watch a run survive its worker.
Further Reading
- Building Long-Running Agents with ScaleDown and Deep Agents — LangChain, October 13, 2026
- AWS Strands Labs releases Strands Decider 2B — MarkTechPost, October 1, 2026
- Strands Agents: interventions — a hands-on walkthrough of
InterventionHandler - LangGraph checkpointing with DynamoDB — AWS documentation
- AgentCore Runtime lifecycle settings — AWS documentation
- LogHub — the labeled log datasets behind the compression bench